



Crude Oil 2026 Outlook: Navigating Bearish Channels
Crude oil’s technical landscape is tightening as multi-year bearish channels continue to pressure prices below $60. With the historic 160-year trendline now in focus, the market faces critical decisions around long-term support and the risks of a deeper drawdown into 2026.
Share this:

Crude oil prices are eyeing 2026 from a bearish bias lens, pressured by supply-glut risks and the dominance of a 2-year downtrend extending from the highs of September 2023. Exporter breakeven prices are also at risk, and demand potential and key levels are in sight to confirm levels potentially defining the 2026 outlook.
Key Events
• OPEC is set to hold production output in Q1 2026, projecting a balanced outlook between supply and demand, while the IEA projects a surplus near 4 million barrels per day.
• World economic growth projections are forecasted by the IMF near 3.1%, reflecting moderate resilience and an oil-demand outlook across major economies following the tariff waves.
• Crude prices are pressured below the 60-barrier and benchmarks for key crude-exporting countries, raising outlooks for buy-the-dip opportunities at key levels ahead.
• Geopolitics remains a consistently uncertain element between sanction escalations, tariffs, and peace-deal supply risks.
• Energy transitions continue to evolve and contribute to a lag in crude demand.
Quantifying Uncertainties via Technical Analysis
From a technical perspective, crude oil’s price action has been dominated by a series of down-trending channels since the peaks of 2022. A more prominent and structurally defined descending channel, extending from the highs of September 2023, continues to pressure prices below the 60 level in line with mounting global supply dynamics.
The 160-year trendline, which has supported crude’s higher lows since the 1860s, is now a key area of focus. It may help quantify the potential depth of any further drawdown and identify long-term support levels should the 55 level be decisively breached heading into 2026.
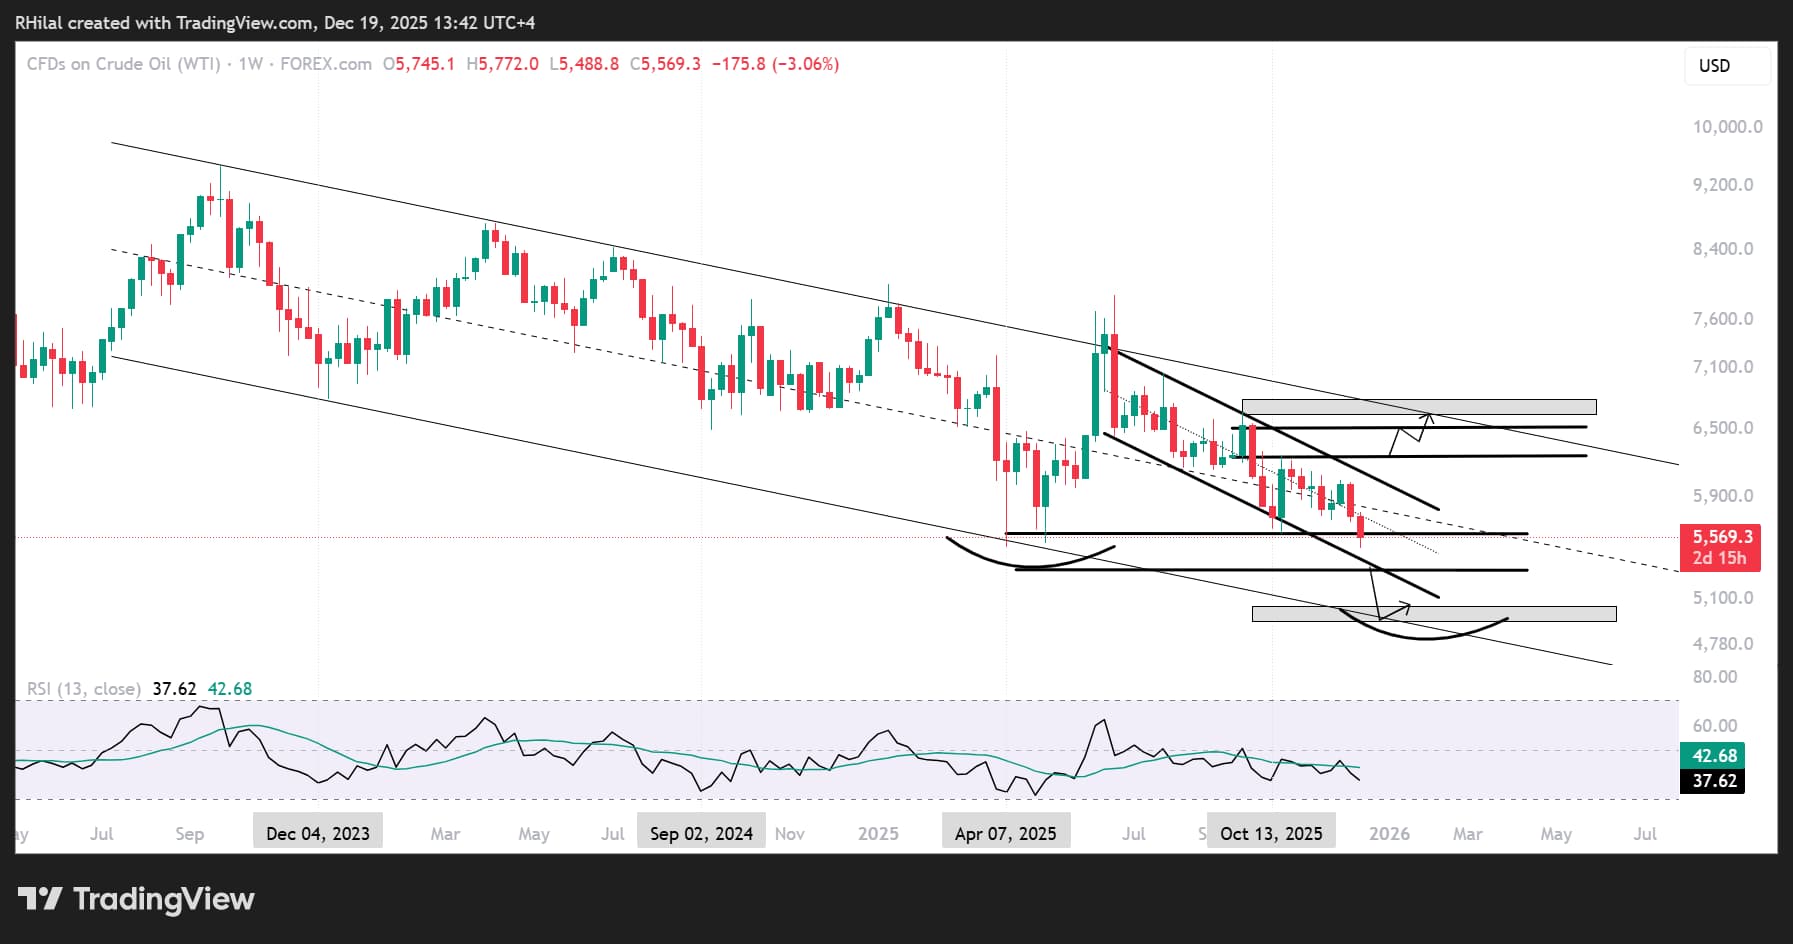
Crude Oil Weekly Outlook: Weekly Time Frame – Log Scale
Source: Trading view
From a weekly-timeframe perspective, crude has been trending within a downward-sloping parallel channel since June 2025, which itself lies within an even broader downtrend dating back to September 2023.
This multi-layered structure reinforces a broader bearish bias and establishes the key levels crude must be clear to transition from short-term fluctuations toward a more constructive long-term outlook.
Upside Structure (Seven-Month Channel)
• 60.50 – Key upside breakout level that crude has been attempting to hold.
• 62.60 – Next major resistance aligned with the upper boundary of the seven-month channel.
• 65 - 66.40 → 68 – A confirmed weekly close above 62.60 could open a path toward the two-year channel boundary at 66.40, then 68, marking early confirmation of a longer-term bullish reversal structure should the trend hold above the channel bounds and 70 psychological level.
Downside Structure
• 55.00 (7-month channel) → 49.00 – A confirmed close below 55 would expose the long-term channel boundary at 49, offering another potential long-term buy-the-dip opportunity.
Crude’s broader structure is leaning toward a potential double-bottom reversal, in line with exporter breakeven price risks, either from the 55 low or the deeper 49 low from the lower 2-year channel border. However, as long as price remains within the down trending channel established since 2023, the overarching bearish bias remains intact.
In terms of Brent
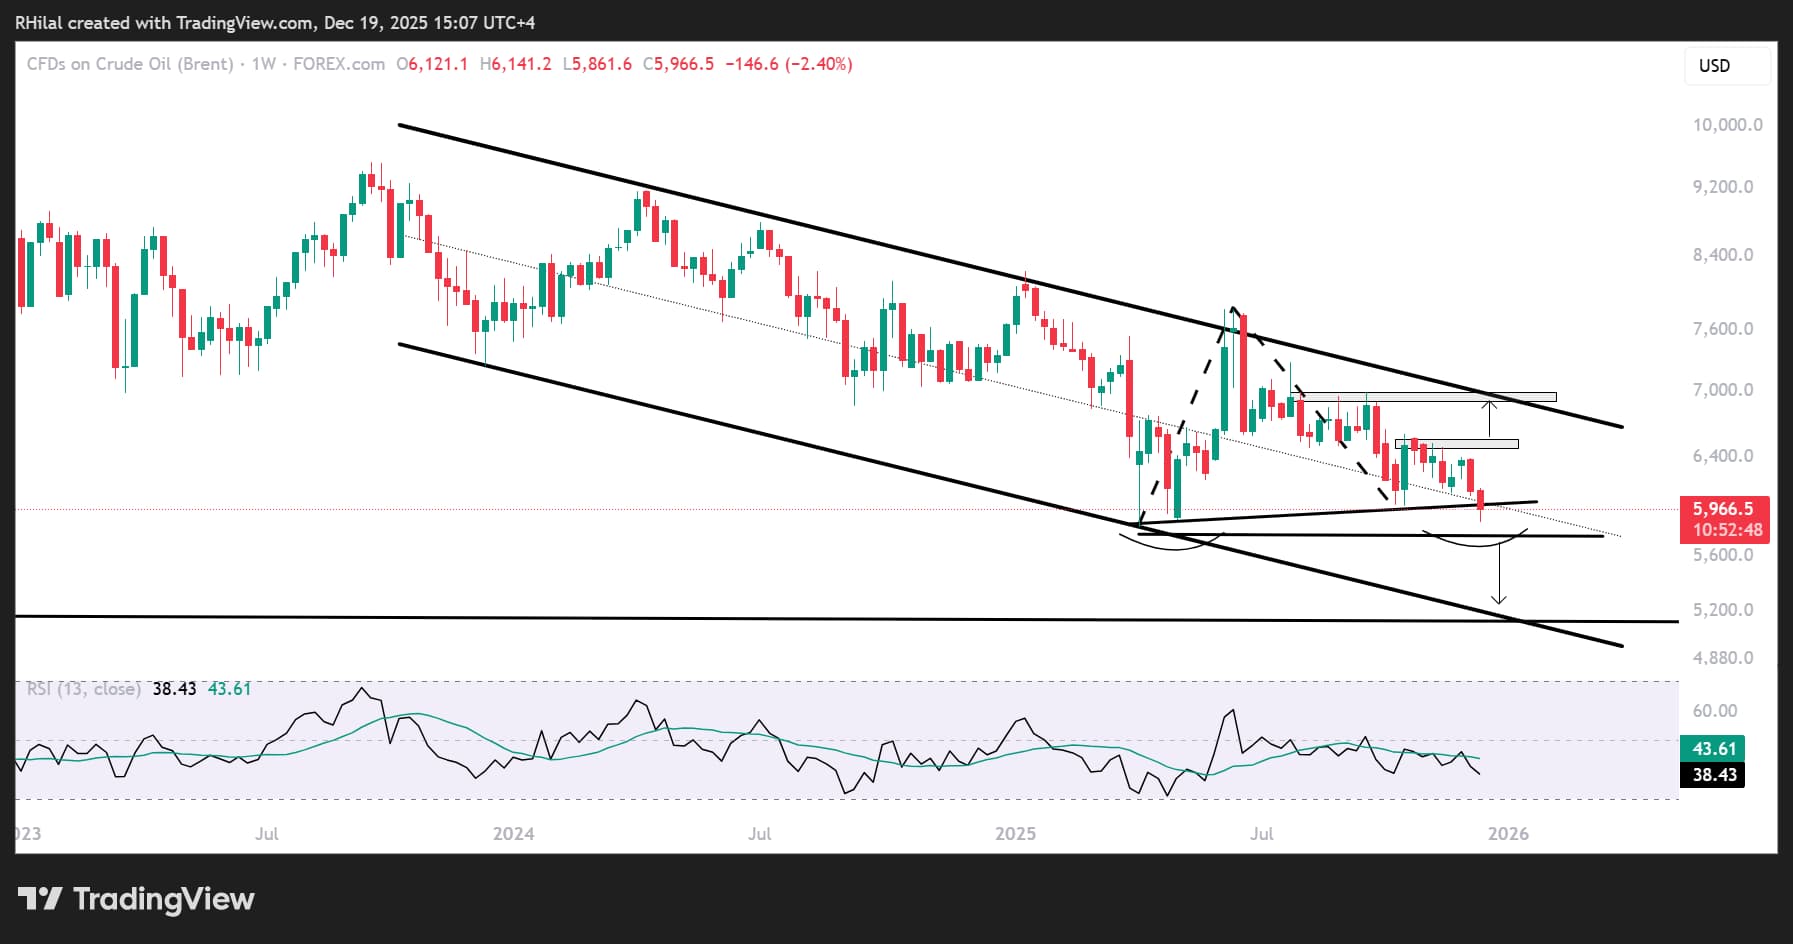
Brent Outlook: Weekly Time Frame – Log Scale
Source: Trading view
UK oil price action is challenging the mid-zone of a well-respected parallel channel originating in December 2023. Despite remaining in a two-year bearish bias, the short-term structure reflects a neutral-to-bearish hold, consistent with broader market behavior.
Upside Key Levels
A clean hold above 64.70 and 66.00 is expected to align gains with the upper channel boundary and the September 2025 highs near the 69–70 zone — the defining barrier between long-term bullish and bearish bias.
Downside Key Levels
A clear trendline connecting higher lows from April through December 2025 defines the short-term bullish structure; however, price action risks a bearish breakout:
• A close below 59.00 would invalidate this trend, targeting 57.70 for a potential double-bottom setup with the yearly lows.
• Extended losses could drive price toward the lower channel boundary near 52.00, aligning with a possible USOIL decline toward 49 and its respective long-term support zone.
These structural levels remain the primary dividing lines between sustained bearish continuation and a long-awaited bullish transition.
The long-term perspective stands on crude’s overall history, despite a complex mix of geopolitical and macroeconomic drivers, where crude respects an up-trending channel seen on the 3-month time frame since the 1860’s, analyzed here to quantify the 2026 drawdown risks/buy-the-dip opportunities for crude.
Crude Oil Outlook: 3-Month Time Frame – Log Scale

Source: Trading view
From this 3-Month timeframe view, crude’s bearish lean is holding at the bottom bound of a consolidation near the 55-mark. A break below this level may extend losses toward the 0.786 Fibonacci channel ratio at 49, with an extreme scenario near 37, aligning with the 160-year channel boundary, breached only once during COVID before rapidly reversing back into the channel. Long-term upside levels remain near 70 first, and 80 second, in line with crude’s long-term trajectory.
Written by Razan Hilal,
Follow on X: Rh_waves
Related tags:
Latest market news




The complete CFD trading experience
Award-winning platforms, competitive spreads, low commissions and dedicated support.
We live and breathe the markets and are dedicated to helping traders realise their ambitions as we continue to set the industry bar.
Economic calendar
Web Trader platform
Our sophisticated web-based platform is packed with features.
Related articles
USD/JPY Weekly Outlook: Volatility Has Left the Building
The yen has ignored broad dollar weakness, falling Treasury yields and renewed market turbulence. Yet its relationship with US interest rates remains intact. So why is USD/JPY going absolutely nowhere fast?
Swiss Franc Forecast: USD/CHF Seven-Week Rally Reverses From Yearly Highs 10 16 2026
A sharp rejection from fresh highs has shifted momentum in favor of USD/CHF bears, raising the stakes for a critical support test.

S&P 500 Forecast: SPX set for a weekly decline led lower by tech as AI worries linger
U.S. stocks have opened mixed as investors continue to worry about the financing behind the AI trade while also looking ahead to more earnings next week.

StoneX Europe Ltd may make third party material available on this website which may contain information included but not limited to the conditions of financial markets. The material is for information purposes only and does not contain, and should not be construed as containing, investment advice and/or investment recommendation and/or an investment research and/or an offer of or solicitation for any transactions in financial instruments; any decision to enter into a specific transaction shall be made by the client following an assessment by him/her of their situation.
StoneX Europe Ltd makes no representation or warranty and assumes no liability as to the accuracy or completeness of the information provided, nor any loss arising from any investment based on a recommendation, forecast or other information supplied. You should always seek independent advice as to your suitability to speculate in any related markets and your ability to assume the associated risks, if you are at all unsure. We are not under any obligation to update any such material. Any opinion made may be personal to the author and may not reflect the opinion of StoneX Europe Ltd.