



Crude Oil 2026 Outlook: Supply Risks in the Headlines
Crude oil prices are eyeing 2026 from a bearish bias lens, pressured by supply-glut risks and the dominance of a 2-year downtrend extending from the highs of September 2023. Exporter breakeven prices are also at risk, and demand potential and key levels are in sight to confirm levels potentially defining the 2026 outlook.
Share this:

Key Events
• OPEC is set to hold production output in Q1 2026, projecting a balanced outlook between supply and demand, while the IEA projects a surplus near 4 million barrels per day.
• World economic growth projections are forecasted by the IMF near 3.1%, reflecting moderate resilience and an oil-demand outlook across major economies following the tariff waves.
• Crude prices are pressured below the 60-barrier and benchmarks for key crude-exporting countries, raising outlooks for buy-the-dip opportunities at key levels ahead.
• Geopolitics remains a consistently uncertain element between sanction escalations, tariffs, and peace-deal supply risks.
• Energy transitions continue to evolve and contribute to a lag in crude demand.
The fundamental outlook for crude remains a fragile mix: markets are wrestling with oversupply worries from rising OPEC and non-OPEC production, fragile demand expectations in line with a cautious FOMC and labor market tone, uneven Chinese growth, alongside accelerating energy transition trends and the possibility of ceasefire or de-escalation deals in key geopolitical hotspots.
However, if demand picks up, especially from China in terms of industrial production, in line with improving global growth, this could reverse the current bias. Crude has been trending in a dominant downside channel since September 2023 and would require a strong catalyst, accompanied by a decisive breakout above the upper bound of this channel (70 mark), to shift the medium-term narrative from “rallies to sell” to “dips to buy, in line with crude’s 160-year uptrend.
FOMC Meeting Raises Caution for 2026
With only one projected rate cut in 2026 so far, followed by a suggested pause, caution is rising for the 2026 growth outlook amid labor-market balancing and Fed chair election risks. The upcoming non-farm payroll report remains a key risk factor for market trends following the year-end Santa-rally period heading into 2026 — unless caution intensifies near the extended and extreme highs of 2025, which already faced strong headwinds from exhausted policy tools under a new presidency.
Supply & Demand Outlook: IEA vs OPEC
The IEA has lowered its 2026 oil surplus forecast to 3.84 million barrels per day, reflecting the combined impact of ongoing sanctions on Russian and Venezuelan supply and a modest improvement in global demand expectations. The agency now anticipates +0.86 mb/d of additional demand in 2026, bringing total global consumption to roughly 105.9 mb/d, against an estimated global supply of around 107 mb/d. This imbalance reinforces the risk of continued oversupply, and any ceasefire agreements or relaxation of sanctions could steepen the supply overhang further, potentially pressuring crude prices toward the mid-50s under a bearish scenario.
OPEC, however, maintains a far tighter view of the 2026 balance. The group has announced a halt to its production unwinding in Q1 2026, projecting a near-balanced market with expected demand of ~106.5 mb/d versus supply estimates of 106.8–107 mb/d. The discrepancy between the IEA’s surplus outlook and OPEC’s balanced view underscores the role of demand uncertainties—particularly global macro sentiment, China’s fuel consumption trajectory, U.S. dollar strength, and geopolitical outcomes including sanctions and ceasefire developments.
Whether OPEC resumes its unwinding of voluntary cuts beyond Q1 2026 will likely depend on how the supply/demand/price dynamic evolves in early 2026. The group remains focused on balancing market stability with the strategic interests of key exporting and importing countries, suggesting production policy will stay flexible and data-dependent.
Increasing Supply over demand potential: Bearish outlook
Improving demand expectations: Bullish outlook
Energy Transitions and Supply Drag
Global Oil Demand Growth by Sector
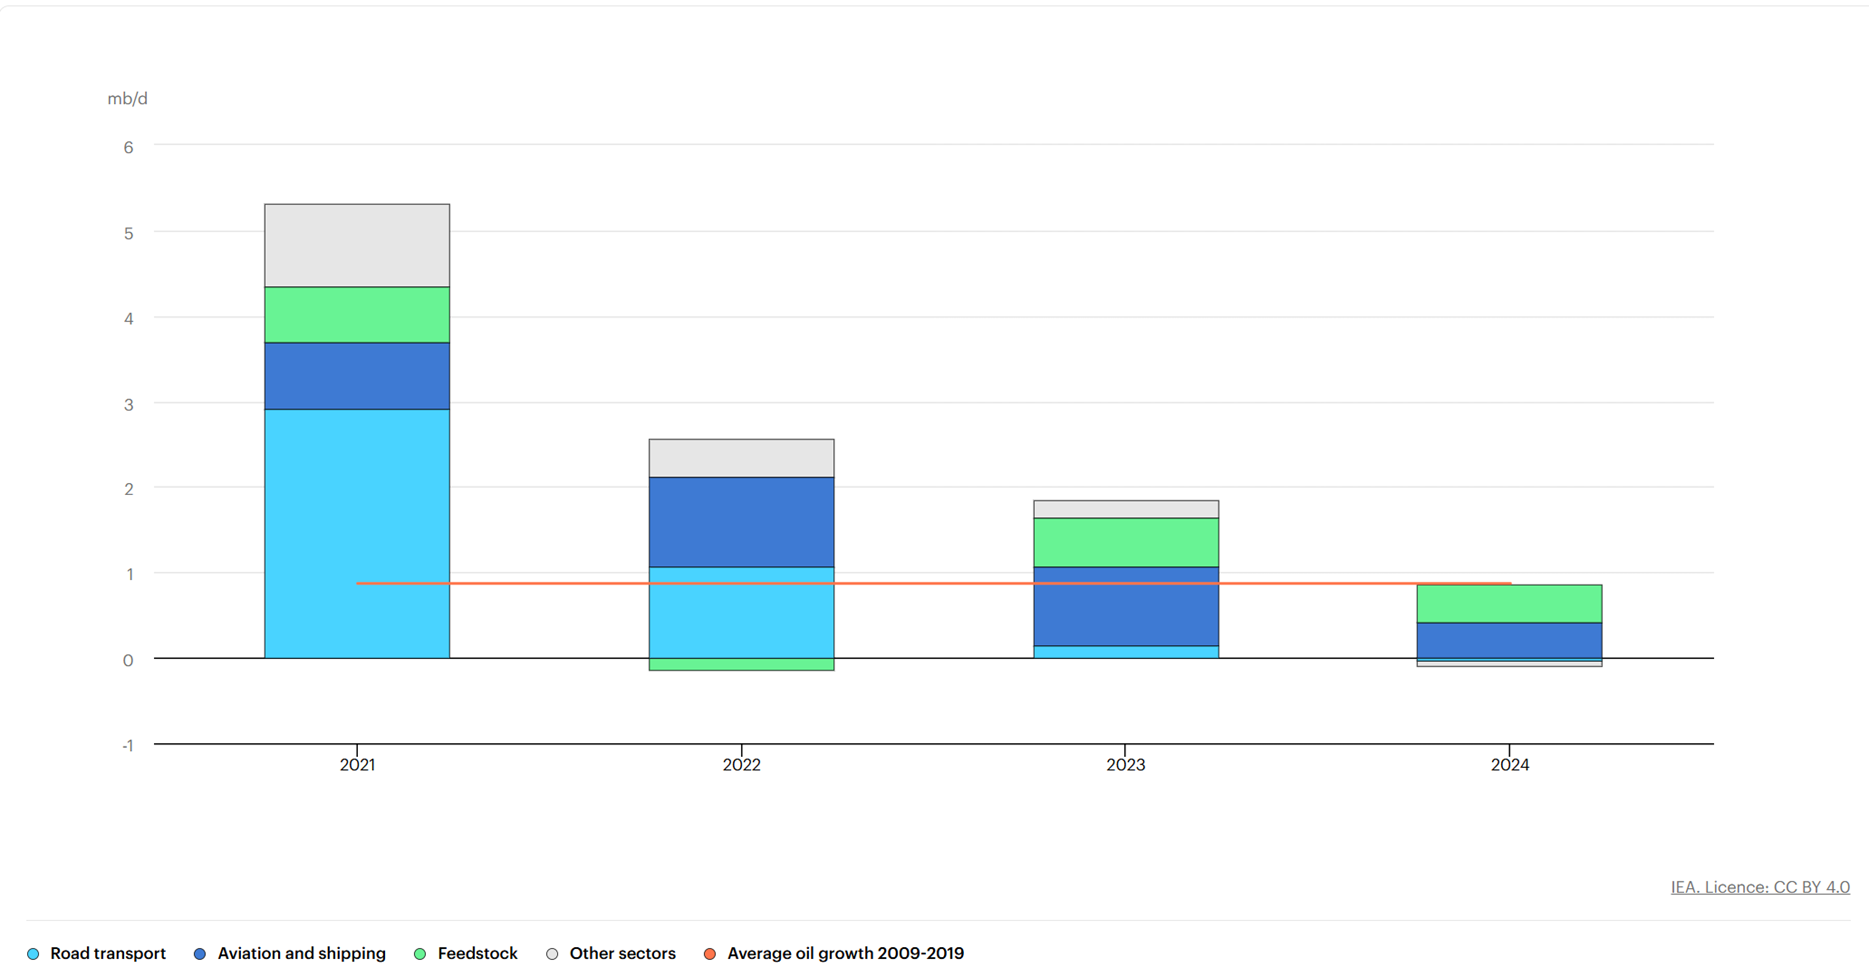
Source: IEA
According to the IEA, global oil demand growth from road transport (shown in light blue) fell sharply from around 2.9 mb/d in 2021 to near-zero growth by 2024, reflecting the impact of rising EV adoption, improved fuel efficiency, and remote working. While the energy transition is slowing transport-related demand, the IEA notes that petrochemicals remain one of the strongest long-term drivers of oil consumption. Plastics, chemicals, solvents, and synthetic fibers rely on crude-derived feedstocks, and petrochemicals are expected to account for around one-third of global oil-demand growth through 2030, adding roughly 3–4 mb/d.
This matters for crude’s long-term trajectory because petrochemical and industrial uses are far harder to replace than gasoline or diesel. Even as EV penetration rises, crude remains essential in manufacturing, packaging, construction materials, fertilizers, and consumer goods, with demand still expanding in Asia. As a result, the IEA expects global oil demand to flatten rather than collapse, with petrochemical growth offsetting stagnation in road-fuel demand.
Geopolitics
The most uncertain element in every crude oil outlook remains geopolitics. U.S. sanctions on Russia, Venezuela, and Iran continue to drive black-market shipments, allowing major importers such as India and China to purchase crude at discounted prices. This dynamic creates geopolitical competition, tariff friction, and strains between the world’s largest economies.
Another factor to watch is the potential removal of Russian sanctions should a peace agreement with Ukraine materialize. Such a development would raise oversupply risks, amplifying concerns around an already fragile demand outlook.
Rising sanction risks: bullish for crude
Peace deals: bearish for crude
With the mentioned risks, crude oil prices are eyeing 2026 from a bearish bias lens, pressured by supply-glut risks and the dominance of a 2-year downtrend extending from the highs of September 2023. Exporter breakeven prices are also at risk, and demand potential and key levels are in sight to confirm levels potentially defining the 2026 outlook.
From a technical perspective, crude oil’s price action has been dominated by a series of down-trending channels since the peaks of 2022. A more prominent and structurally defined descending channel, extending from the highs of September 2023, continues to pressure prices below the 60 level in line with mounting global supply dynamics.
The 160-year trendline, which has supported crude’s higher lows since the 1860s, is now a key area of focus. It may help quantify the potential depth of any further drawdown and identify long-term support levels should the 55 level be decisively breached heading into 2026.
Crude Oil Weekly Outlook: Weekly Time Frame – Log Scale

Source: Trading view
From a weekly-timeframe perspective, crude has been trending within a downward-sloping parallel channel since June 2025, which itself lies within an even broader downtrend dating back to September 2023.
This multi-layered structure reinforces a broader bearish bias and establishes the key levels crude must be clear to transition from short-term fluctuations toward a more constructive long-term outlook.
Upside Structure (Seven-Month Channel)
• 60.50 – Key upside breakout level that crude was previously attempting to hold.
• 62.60 – Next major resistance aligned with the upper boundary of the seven-month channel.
• 65 - 66.40 → 68 – A confirmed weekly close above 62.60 could open a path toward the two-year channel boundary at 66.40, then 68, marking early confirmation of a longer-term bullish reversal structure should the trend hold above the channel bounds and 70 psychological level.
Downside Structure
• 55.00 (7 month channel support)→ 49.00 – A confirmed close below 55 would expose the long-term channel boundary at 49, offering another potential long-term buy-the-dip opportunity.
Crude’s broader structure is leaning toward a potential double-bottom reversal, in line with exporter breakeven price risks, either from the 55 low or the deeper 49 low from the lower 2-year channel border. However, as long as price remains within the down trending channel established since 2023, along with declining global oil demand growth, the overarching bearish bias remains intact.
Written by Razan Hilal, CMT
Follow on X: @Rh_waves
Latest market news




The complete CFD trading experience
Award-winning platforms, competitive spreads, low commissions and dedicated support.
We live and breathe the markets and are dedicated to helping traders realise their ambitions as we continue to set the industry bar.
Economic calendar
Web Trader platform
Our sophisticated web-based platform is packed with features.
Related articles
S&P 500 Forecast: SPX set for a weekly decline led lower by tech as AI worries linger
U.S. stocks have opened mixed as investors continue to worry about the financing behind the AI trade while also looking ahead to more earnings next week.


DAX Rebounds, but 25,600 Remains the Level to Hold
The DAX continues to recover from last week's sell-off, supported by easing energy concerns and improving short-term momentum. While buyers have regained control of the four-hour trend, the index is now approaching a critical resistance zone between 25,450 and 25,600. A decisive break higher would strengthen the bullish case and open the door toward 25,800, while failure at resistance could quickly revive downside pressure.


S&P 500 Forecast: SPX Falls after hot inflation and as AI debt concerns mount
U.S. stocks are falling after hotter-than-expected readings on producer prices and retail sales, while concerns over AI-related debt are also mounting.
StoneX Europe Ltd may make third party material available on this website which may contain information included but not limited to the conditions of financial markets. The material is for information purposes only and does not contain, and should not be construed as containing, investment advice and/or investment recommendation and/or an investment research and/or an offer of or solicitation for any transactions in financial instruments; any decision to enter into a specific transaction shall be made by the client following an assessment by him/her of their situation.
StoneX Europe Ltd makes no representation or warranty and assumes no liability as to the accuracy or completeness of the information provided, nor any loss arising from any investment based on a recommendation, forecast or other information supplied. You should always seek independent advice as to your suitability to speculate in any related markets and your ability to assume the associated risks, if you are at all unsure. We are not under any obligation to update any such material. Any opinion made may be personal to the author and may not reflect the opinion of StoneX Europe Ltd.