



Crude Oil Analysis: WTI remains weak below the $90 level
Recent sessions have been challenging for WTI crude, which had shown strength just weeks ago. Over the last six trading sessions, the price has declined by more than 15%, not only falling below the $100 level, but also remaining below the key psychological level of $90 per barrel.
Share this:

Recent sessions have been challenging for WTI crude, which had shown strength just weeks ago. Over the last six trading sessions, the price has declined by more than 15%, not only falling below the $100 level, but also remaining below the key psychological level of $90 per barrel.
Selling pressure has persisted due to the perception of a temporary truce, which could lead to more structured negotiations in the Middle East. As this scenario continues to develop, it is likely that weakness will remain a key feature in WTI price action in the coming sessions.


A sense of calm persists
Despite ongoing threats — such as recent statements from Iran about potentially extending the blockade toward the Red Sea if the U.S. maintains port restrictions — the market appears to be focusing more on the absence of a meaningful escalation in the conflict.
This has led to a significant reduction in fear and uncertainty regarding potential disruptions to global oil supply, opening the door to a scenario where negotiations could extend the current ceasefire.
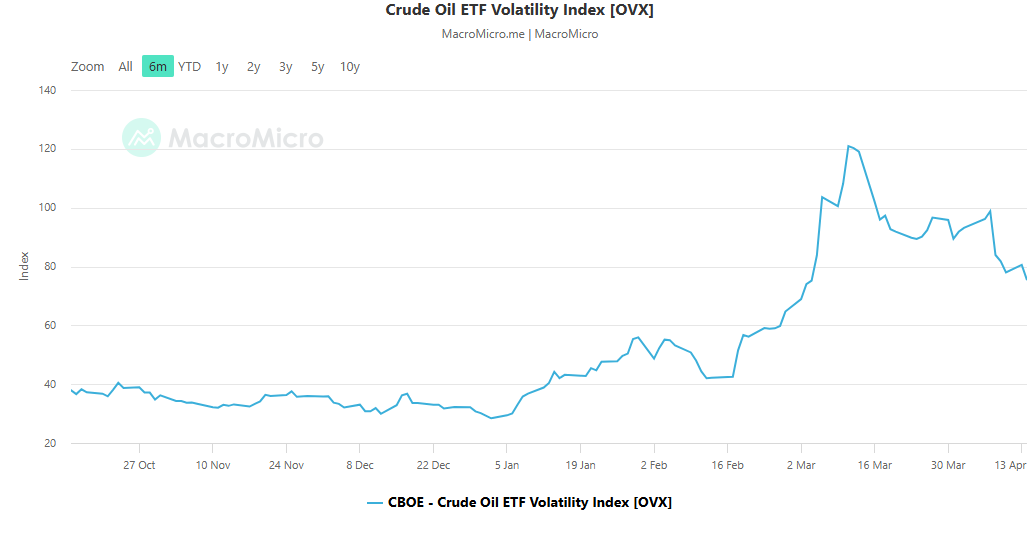
This environment is reflected in the behavior of the OVX index, which measures implied volatility in oil markets. The indicator has dropped from levels near 120 points to around 75, maintaining a consistent downward trend and signaling a decline in expected volatility in the short term.
Source: Macromicro
The drop in OVX suggests that the market no longer anticipates aggressive price swings, implying a lower geopolitical risk premium and reduced demand for hedging positions in oil.
With this backdrop, the absence of escalation has allowed optimism to return to markets, lowering expectations for sharp price movements in WTI. If this dynamic continues, the weakness observed in recent sessions could remain in place, particularly if progress is confirmed in negotiations between the United States and Iran.
Could recent OPEC data become a concern?
A key factor to monitor in the coming weeks is that, despite the decline in uncertainty, the effects of the conflict are already visible in production dynamics.
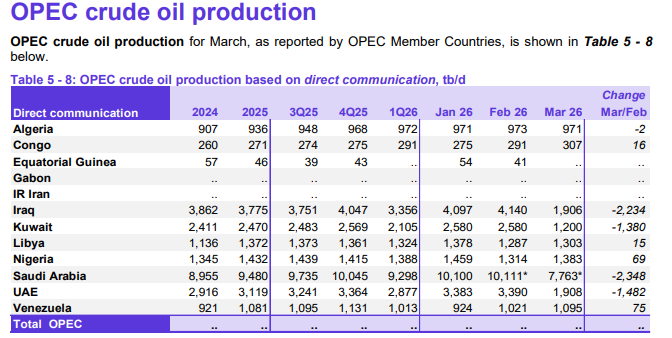
The latest OPEC report shows significant declines in output across several countries. Saudi Arabia reduced production from over 10 million barrels per day in February to around 7.7 million in March, Iraq dropped from more than 4 million to below 2 million, and Kuwait also saw a decline from 2.5 million to around 1.2 million barrels per day.
Source: OPEP
These figures are important, as they reflect a substantial loss of supply caused by the conflict. The key challenge now will be to restore these production levels. If OPEC fails to bring supply back to earlier levels, production disruptions could persist even if the conflict is resolved, potentially leading to a recovery in WTI prices in the medium term.
WTI Technical Outlook
Source: StoneX, Tradingview
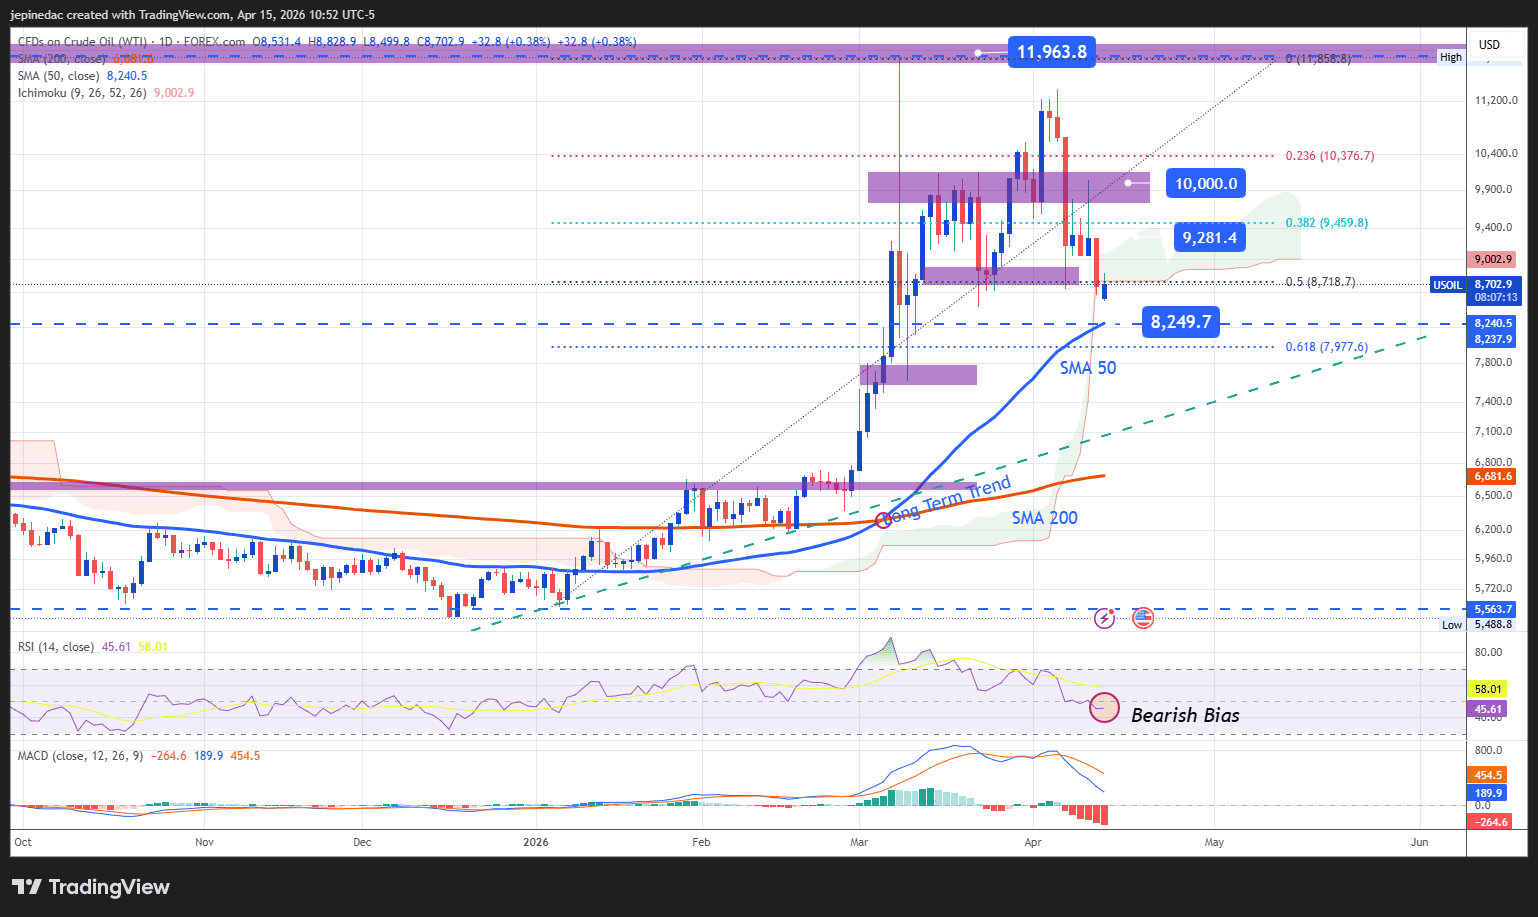
- Bearish momentum gains relevance: Although WTI had been showing a strong upward trend in previous weeks, recent declines have broken that structure and shifted the market into a more consistent bearish bias in the short term. If selling pressure persists, it could lead to the formation of a more defined downtrend, especially if key technical levels are broken in the coming sessions.
- RSI: The RSI remains below the 50 level, indicating that selling momentum dominate over the last 14 sessions. As long as this dynamic persists, downside pressure is likely to remain relevant.
- MACD: The MACD histogram remains below the zero line, confirming that short-term moving average momentum is in bearish territory, reinforcing the current trend.
Key levels:
- $100 – Key resistance: A critical psychological level. A move back above this level could restore a bullish bias and revive the upward scenario seen in previous weeks.
- $92 – Near-term barrier: A key neutral zone that has acted as a retracement area in recent sessions. Price action around this level could lead to a more consistent sideways or indecisive phase.
- $82 – Key support: A recent low that also aligns with the 50-period moving average and the 61.8% Fibonacci retracement level. A break below this zone could reinforce the bearish bias and support the development of a more structured downtrend.
Written by Julian Pineda, CFA, CMT – Market Analyst
Follow him on: @julianpineda25



The complete CFD trading experience
Award-winning platforms, competitive spreads, low commissions and dedicated support.
We live and breathe the markets and are dedicated to helping traders realise their ambitions as we continue to set the industry bar.
Economic calendar
Web Trader platform
Our sophisticated web-based platform is packed with features.
Related articles

Silver Analysis: XAG/USD Falls Back to Annual Lows
Recent sessions have been particularly challenging for silver prices in the short term. Selling pressure has intensified considerably, resulting in three consecutive losing sessions and pushing the metal to a decline of nearly 8.5% over this period.

Nasdaq 100 Forecast: NDX falls after hotter inflation data
U.S. stocks are falling after hotter-than-expected U.S. inflation data, which has lifted Fed rate hike expectations.


S&P 500 Forecast: SPX holds steady as tech stocks decline and banks rise post-earnings
U.S. stocks are mixed ahead of the open on Tuesday, with tech stocks leading the decline as investors also weigh bank earnings.
StoneX Europe Ltd may make third party material available on this website which may contain information included but not limited to the conditions of financial markets. The material is for information purposes only and does not contain, and should not be construed as containing, investment advice and/or investment recommendation and/or an investment research and/or an offer of or solicitation for any transactions in financial instruments; any decision to enter into a specific transaction shall be made by the client following an assessment by him/her of their situation.
StoneX Europe Ltd makes no representation or warranty and assumes no liability as to the accuracy or completeness of the information provided, nor any loss arising from any investment based on a recommendation, forecast or other information supplied. You should always seek independent advice as to your suitability to speculate in any related markets and your ability to assume the associated risks, if you are at all unsure. We are not under any obligation to update any such material. Any opinion made may be personal to the author and may not reflect the opinion of StoneX Europe Ltd.