







Crude Oil Challenges $65, Silver Climbs to 13-Year Highs Above $36/oz
Crude Oil, Silver Outlook: Crude Oil Challenges the $65 Resistance Amid Declining Supply on Summer Demand, Silver Climbs to 13-Year Highs Above $36/oz Ahead of London AI Summit.
Share this:

Key Events
- US-China Negotiations on Tariffs and Rare Earth Minerals
- Silver Surges to 13-Year Highs Above $36/oz
- Crude Oil Holds Below $65 as Inventories Drop by 4.3-Million Barrels to 2024 Lows
- US CPI Set to Be Overshadowed by Tariff Talks and Market Anticipation
With summer demand building and markets showing resilience amid ongoing US-China tariff negotiations, global indices are edging toward record highs. Crude oil remains capped below the $65 mark, while silver has surged to a 13-year high above $36 per ounce—driven by expectations of accelerating economic activity, continued recovery, and rapid technological advancement.
US-China trade negotiations on rare earths are set to take place alongside this week’s AI Innovation Conference in London—both events pivotal in shaping global demand outlooks for energy and technology sectors.
Meanwhile, US crude inventories have dropped by 4.3 million barrels to their lowest level since December 2024. This supports oil’s bullish tone, reinforced by OPEC’s cautious supply management and lingering geopolitical tensions involving Russia, Ukraine, and the Middle East.
Risks persist, particularly around the potential implementation of disruptive policies under Trump’s proposed economic agenda.
Technical Analysis
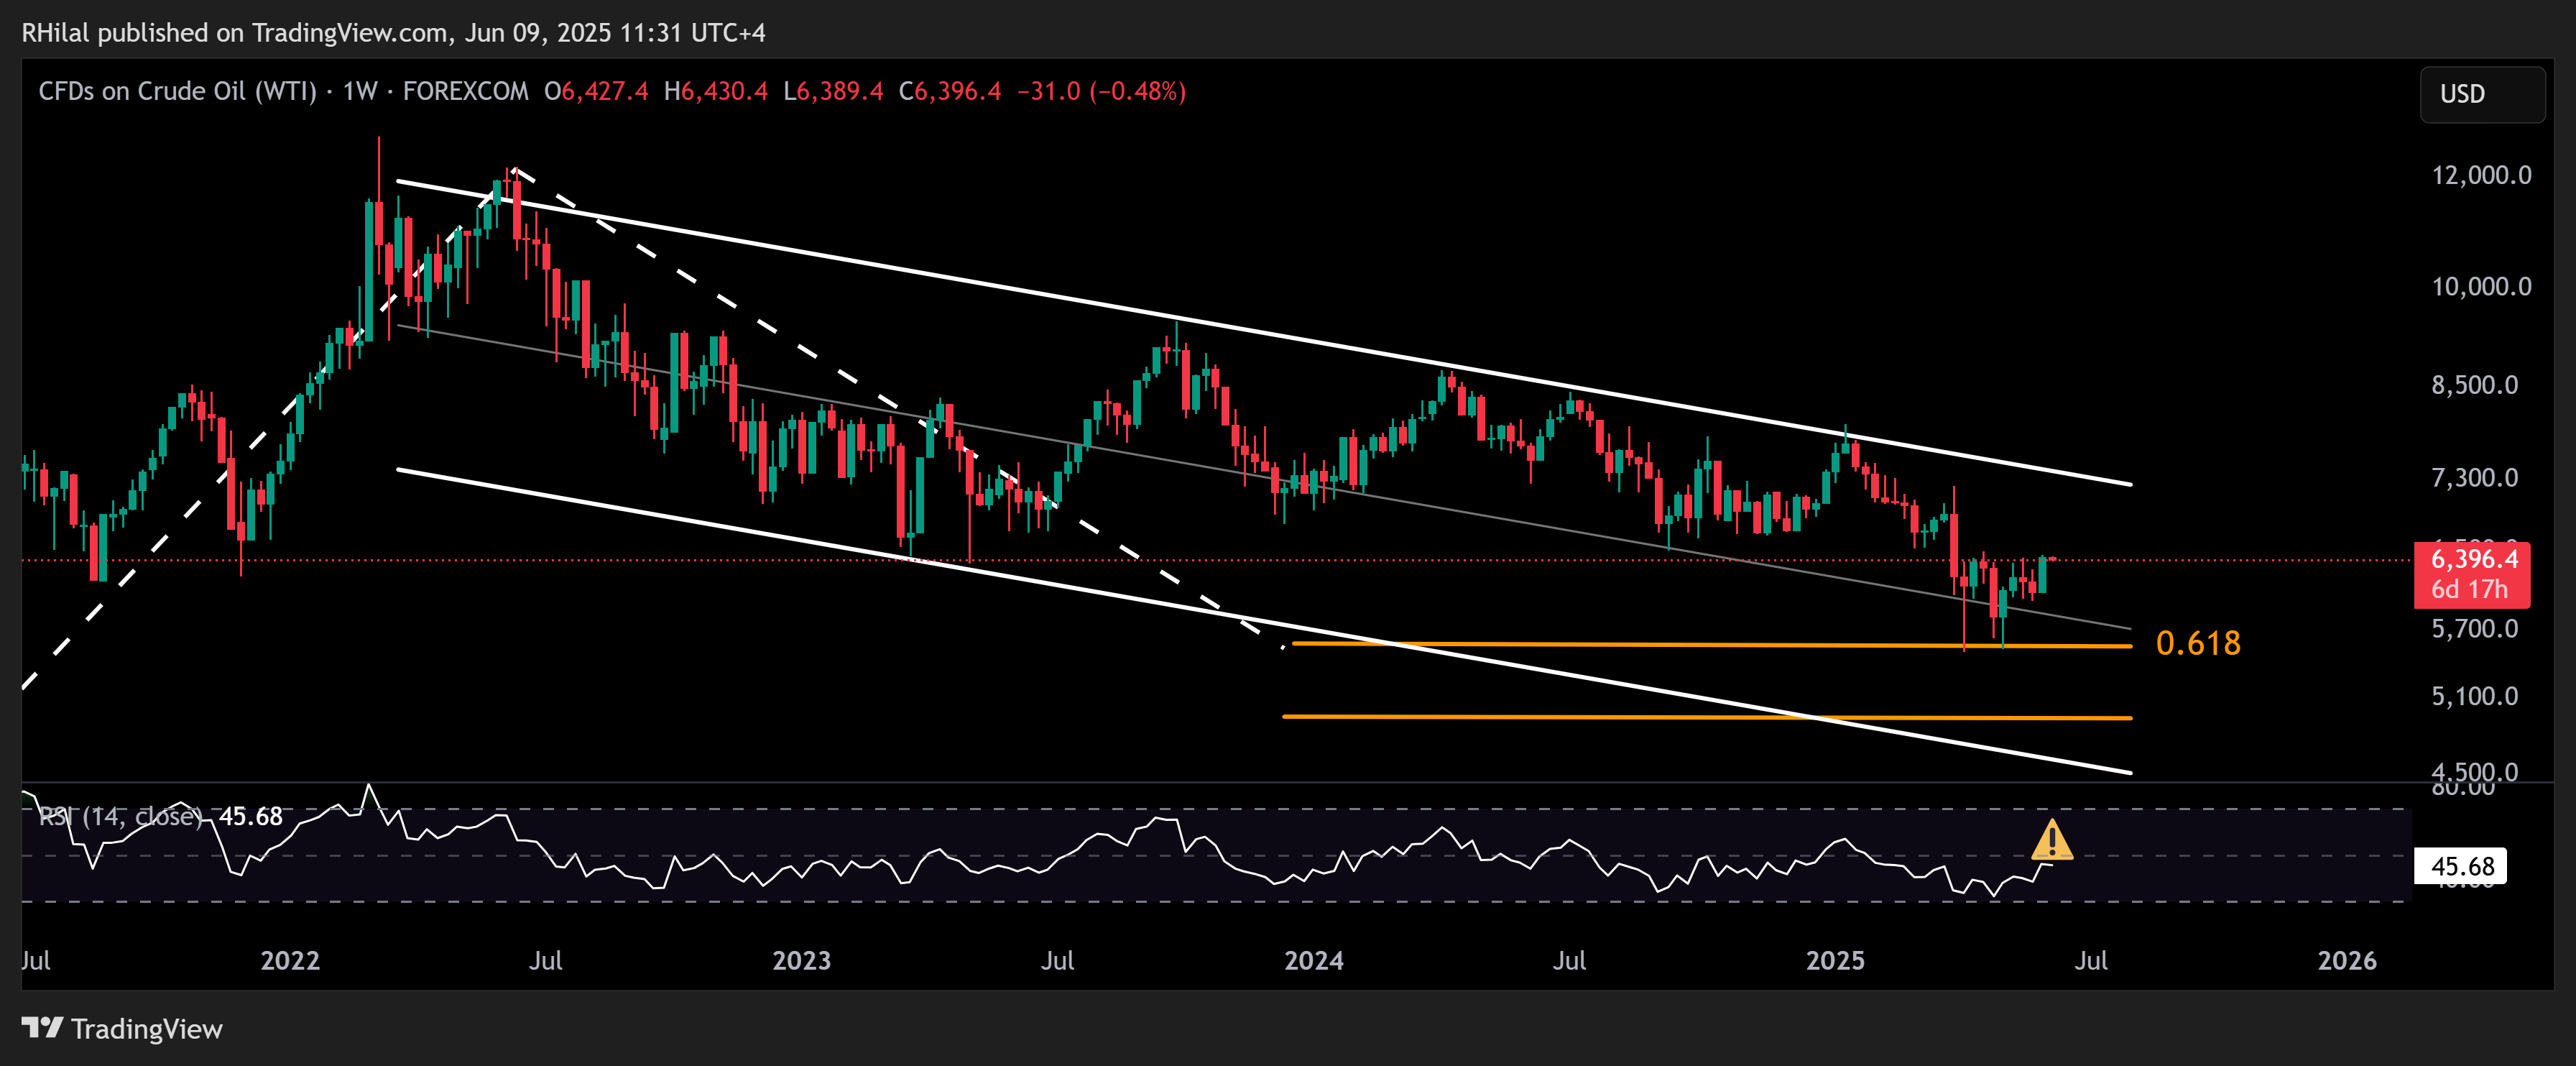
Crude Oil Outlook: Weekly Time Frame – Log Scale
Source: Tradingview
On the weekly chart, crude oil trades above the mid-range of a descending channel that has been in place since the 2022 highs. The RSI remains just below the neutral zone, suggesting a cautiously bullish-to-neutral outlook while prices hover beneath the $65 resistance level.
Crude Oil Outlook: Daily Time Frame – Log Scale
Source: Tradingview
From a daily perspective, oil prices remain capped below $65. A firm breakout above this level could pave the way toward $66 and potentially retest the $71 level. On the downside, the psychological support at $60 remains critical.
A break below $60—and more critically, below the $58 moving average—could reintroduce long term bullish positioning from $55 and $49. OPEC's willingness to manage supply levels near the $55 region has reinforced bullish sentiment, particularly as the market enters the summer demand season.
Silver Outlook: Weekly Time Frame – Log Scale
Source: Tradingview
Silver has surged past the $36.40 per ounce mark, reaching its highest level in 13 years after a clean breakout from a one-month consolidation phase spanning April and May 2025. The breakout targets the $37.30 level and aligns with a rising channel defined by higher lows since February 2024.
If silver retraces below $37, potential support levels include $34.70, $33.70, and $32.70, which may offer a base for consolidation or a recharge before continuation of the broader uptrend. A sustained hold above $37.30 could open the path toward the $40 level, further validating a larger inverted head and shoulders pattern on the monthly chart.
Silver Outlook: Monthly Time Frame – Log Scale
Source: Tradingview
From a monthly perspective, silver is tracing the breakout of its inverted head and shoulders pattern that extended between August 2020 and April 2024, in the direction of the 37 and 40 price zones. A clean hold above the 40-mark may open the way back towards 2011 records near 44, 50, and 53 highs. Drawdown risks may also be near as silver approaches its monthly time frame pattern target near 37.30, the 40 psychological mark, and overbought RSI levels last seen in 2020.
Written by Razan Hilal, CMT
Follow on X: @Rh_waves
Related tags:




The complete CFD trading experience
Award-winning platforms, competitive spreads, low commissions and dedicated support.
We live and breathe the markets and are dedicated to helping traders realise their ambitions as we continue to set the industry bar.
Economic calendar
Web Trader platform
Our sophisticated web-based platform is packed with features.
Related articles

Dow Jones Forecast: DJIA rises after weaker jobs data
U.S. stocks are rising after weaker-than-expected U.S. jobs data saw markets rein in rate hike expectations.


Gold Price Forecast: XAU/USD Plunges 12.4% Toward Critical Support 10 1 2026
Softer inflation has revived expectations for a Fed pause, but Friday’s payrolls could put gold’s recovery prospects to the test.


Nasdaq 100 Forecast: NDX slips as Treasury yields keep rising
U.S. stocks are falling at the start of Q4, as gains in software stocks offset concerns over soaring Treasury yields. U.S. Treasury yields continue to rise, with the 10-year yield up 2 basis points at 5.31% and the 30-year at 5.66%, multi-decade highs.
StoneX Europe Ltd may make third party material available on this website which may contain information included but not limited to the conditions of financial markets. The material is for information purposes only and does not contain, and should not be construed as containing, investment advice and/or investment recommendation and/or an investment research and/or an offer of or solicitation for any transactions in financial instruments; any decision to enter into a specific transaction shall be made by the client following an assessment by him/her of their situation.
StoneX Europe Ltd makes no representation or warranty and assumes no liability as to the accuracy or completeness of the information provided, nor any loss arising from any investment based on a recommendation, forecast or other information supplied. You should always seek independent advice as to your suitability to speculate in any related markets and your ability to assume the associated risks, if you are at all unsure. We are not under any obligation to update any such material. Any opinion made may be personal to the author and may not reflect the opinion of StoneX Europe Ltd.