



Crude Oil Weekly Outlook: On the Edge of a Bullish Breakout
Crude oil prices are challenging a breakout from a dominant 2.5-year downtrend as US–Iran tensions rise. Trump tariff risks are also resurfacing, threatening the broader setup.
Share this:

Key Events
- WTI and Brent are testing a bullish breakout from a 2.5-year dominant downtrend amid rotations into energy and defense sectors.
- US crude inventories recorded a six-month low at -9 million barrels, while US Advance GDP dropped to 1.4%.
- A Supreme Court ruling against Trump-era tariffs triggered a retaliatory response, with an additional 15% tariff proposal on a global scale, threatening renewed risk-off sentiment across markets.
I posted a Brent chart analysis on Friday detailing the key levels and setups currently facing crude. The bullish structure clearly carries inflationary and rate expectation implications. However, with global tariff risks resurfacing, prices are facing more than just US–Iran truce risks that could trigger another bearish pullback.
Key levels remain intact despite swinging headlines and shifting catalysts.
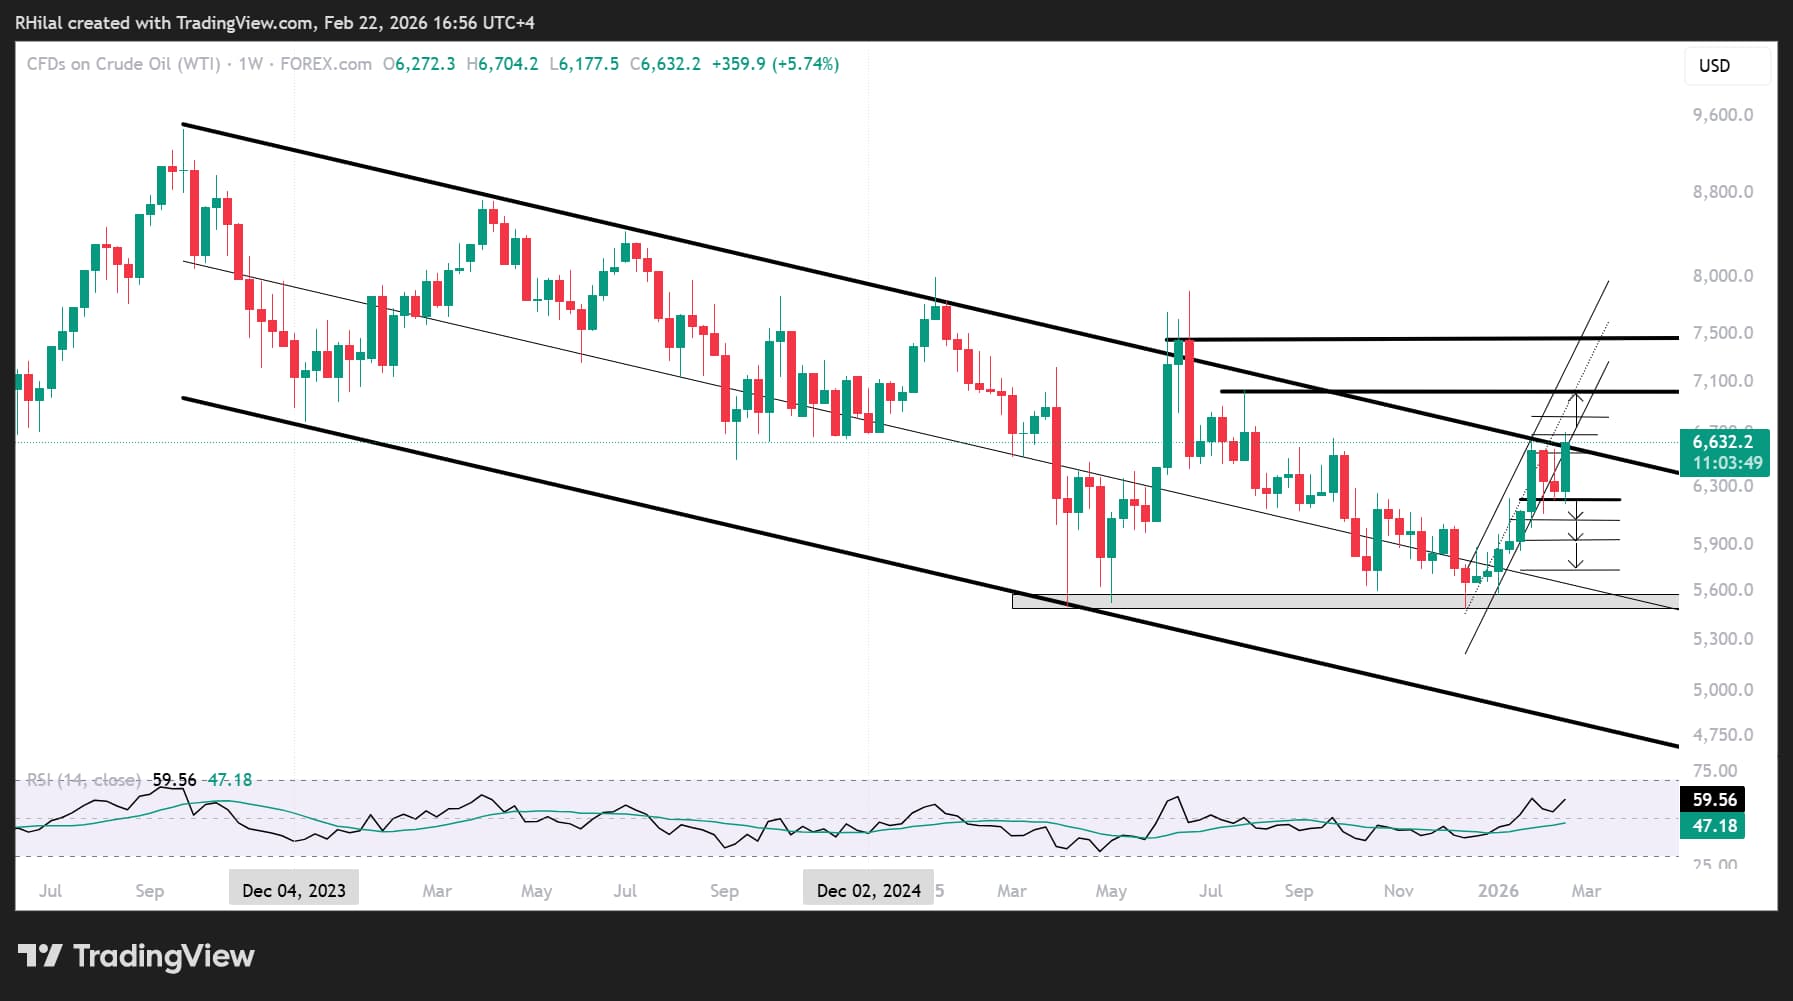
From a price action perspective, crude oil has maintained a bullish bias since December 2025, supported by winter demand and supply disruption concerns. The recent rebound above the 65 mark aligns with upside hedging activity in options markets, alongside investor rotation out of software and AI, and even financials, into defense and energy.
However, as risk-off appetite looms and global tariff threats intensify, this mix could cap crude’s strength as it tests the upper bound of a 2023–2026 descending channel for the third time this year, placing the market at a potential structural breakout point.
Crude Oil Weekly Outlook – Log Scale
Source: Trading view
Key resistance currently sits near 66.80. A break above this level exposes 68.40, 70.40, and 74, levels last seen during the June 2025 Middle East escalation.
A weekly close above 74 would confirm a structural shift, opening the door toward 80 and reinforcing longer-term bullish expectations, with potential implications for renewed global inflation pressures and prolonged rate-hold expectations.
Failure to hold above 62 would reassert bearish dominance, shifting focus back toward the 50s. Such a reversal would likely be supported by either a US–Iran truce or escalating global tariff fears weighing on growth expectations.
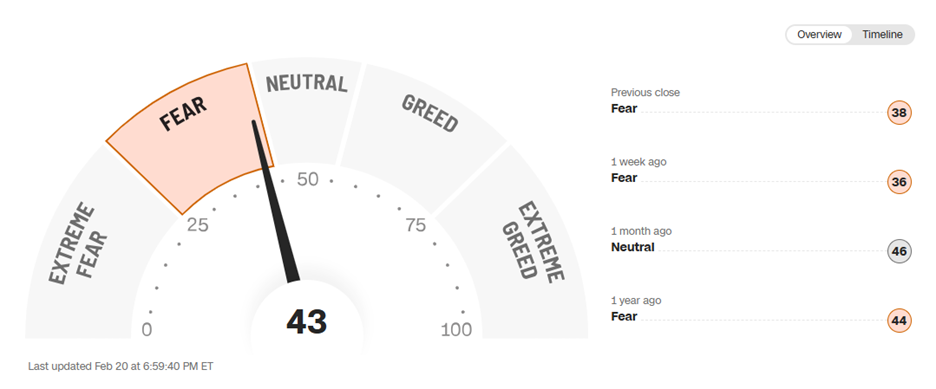
With the energy sector leading in a risk-off environment, overall sentiment remains cautious. The CNN Fear & Greed Index continues to signal fear, with readings below 50, although conditions have improved slightly from earlier in the week.
This dynamic raises both contrarian interest and the risk of sharp reversals.
Source: CNN
This sentiment tone, combined with elevated crude prices, is sustaining haven demand. Gold and silver are holding near key breakout levels near 5,100 and 80, while the DXY tests resistance near 97.70.
Renewed tariff risks may also cap gains in energy and havens, portraying a setup similar to April 2025 — one that could trigger a broader momentum reset before primary bull trends comfortably resume their course.
Written by Razan Hilal, CMT
Follow on X: @Rh_waves



The complete CFD trading experience
Award-winning platforms, competitive spreads, low commissions and dedicated support.
We live and breathe the markets and are dedicated to helping traders realise their ambitions as we continue to set the industry bar.
Economic calendar
Web Trader platform
Our sophisticated web-based platform is packed with features.
Related articles

USD/JPY weekly outlook: Quarter turn scrambles rates regime
USD/JPY’s tight relationship with front-end US rates broke down sharply last week, but quarter-turn flows and positioning suggest the disconnect may prove temporary.


Dow Jones Forecast: DJIA rises after weaker jobs data
U.S. stocks are rising after weaker-than-expected U.S. jobs data saw markets rein in rate hike expectations.


What Stretched 10-Year Yields Mean for Major Currency Pairs in Q4
U.S. 10-year Treasury yields are nearing a long-term resistance zone with overbought RSI readings, raising near-term pullback risk for the dollar.
StoneX Europe Ltd may make third party material available on this website which may contain information included but not limited to the conditions of financial markets. The material is for information purposes only and does not contain, and should not be construed as containing, investment advice and/or investment recommendation and/or an investment research and/or an offer of or solicitation for any transactions in financial instruments; any decision to enter into a specific transaction shall be made by the client following an assessment by him/her of their situation.
StoneX Europe Ltd makes no representation or warranty and assumes no liability as to the accuracy or completeness of the information provided, nor any loss arising from any investment based on a recommendation, forecast or other information supplied. You should always seek independent advice as to your suitability to speculate in any related markets and your ability to assume the associated risks, if you are at all unsure. We are not under any obligation to update any such material. Any opinion made may be personal to the author and may not reflect the opinion of StoneX Europe Ltd.