



Dow Jones Analysis: Tests Resistance as Breakout Risk Builds
The Dow is trading between downtrend resistance and the key 45000 level. With the price coiling between both, something has to give.
Share this:

- Dow stages failed breakout on Monday
- Price remains pinned against downtrend resistance
- 45000 key support below
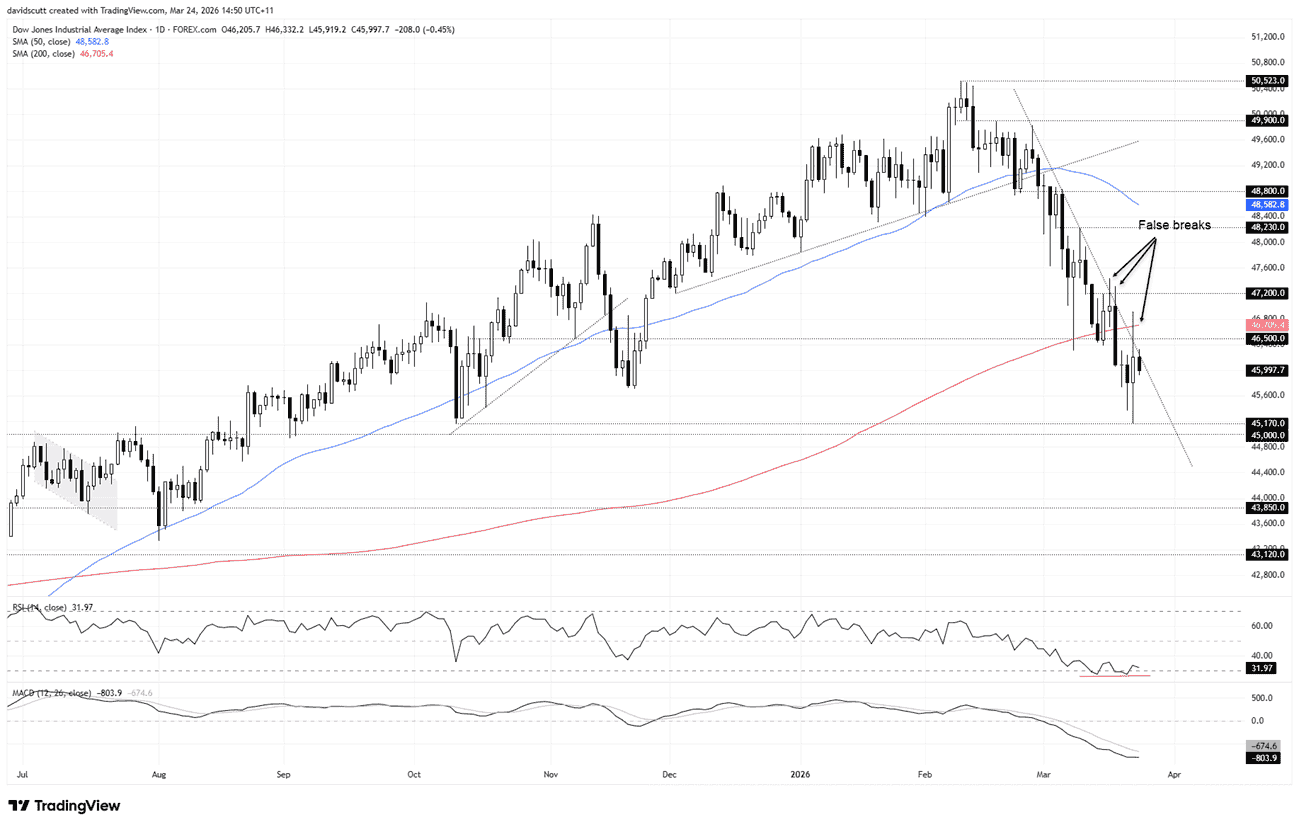
Sitting in a protracted downtrend and wedged up against resistance, a breakout in our Dow Jones contract may soon be on the cards as the price nears the key 45000 level. While the price action and momentum indicators suggest risks are skewed to the downside, in this unique market environment, a bullish breakout hardly seems a stretch either.
Source: TradingView
On Monday, we saw a bullish breakout attempt fail, with an initial rally reversing sharply from a resistance zone comprising the March downtrend, former horizontal support at 46500, along with the 200DMA. For bulls, that’s the zone that needs to be overcome to build confidence that the lows are in.
With the contract now sandwiched against the downtrend, price action over the remainder of Tuesday looms as important. A break and close above the 200DMA would signal that a new trend may be underway, especially if accompanied by a successful backtest and bounce. If that were to occur, 47200 and 48230 are minor resistance levels before the 50DMA comes into view.
For bears, you’ve had a good run from the record highs above 50000, but a key downside test of the trend sits at 45000. While the price bottomed at 45170 on Monday, coinciding with the low set on October 10 last year, it’s the former that looks far more formidable, having acted as resistance for lengthy periods before eventually breaking, followed by a backtest that held. A sustained break beneath 45000 would open the door for a potential run towards 43850 or 43120 initially.
The message from RSI (14) and MACD still leans bearish, although with both now flattening out, downside pressure is no longer building. In normal circumstances, that would favour short setups over longs. But this is not a normal circumstance.
Related tags:
Latest market news




The complete CFD trading experience
Award-winning platforms, competitive spreads, low commissions and dedicated support.
We live and breathe the markets and are dedicated to helping traders realise their ambitions as we continue to set the industry bar.
Economic calendar
Web Trader platform
Our sophisticated web-based platform is packed with features.
Related articles
Canadian Dollar Short-term Outlook: USD/CAD Five-Week Rally Hits a Wall at Major Resistance 10 14 2026
USD/CAD is holding near fresh yearly highs, but bearish divergence and a well-defined October range raise the stakes at major resistance.
USD/JPY forecast: hot US CPI lifts the pair above its 200-day average
Hotter-than-expected US inflation has pushed USD/JPY above its 200-day moving average, putting 160 and the risk of Bank of Japan intervention back in focus. The breakout still needs to hold, and a failure could send the pair sharply lower.


Dow Jones outlook: CPI, oil and yields put the rally to the test
US index futures rebounded in the first half of Wednesday’s session, along with European indices ahead of the release of US CPI. Some slightly dovish remarks from the Fed’s Williams seem to have helped sentiment a little, but whether those comments will be backed by data remains to be seen. While slightly hotter than expected inflation data shouldn’t be enough for markets to price in an October Fed hike with more than a coin flip probability, it can nonetheless reinforce expectations of further tightening later in the year.
StoneX Europe Ltd may make third party material available on this website which may contain information included but not limited to the conditions of financial markets. The material is for information purposes only and does not contain, and should not be construed as containing, investment advice and/or investment recommendation and/or an investment research and/or an offer of or solicitation for any transactions in financial instruments; any decision to enter into a specific transaction shall be made by the client following an assessment by him/her of their situation.
StoneX Europe Ltd makes no representation or warranty and assumes no liability as to the accuracy or completeness of the information provided, nor any loss arising from any investment based on a recommendation, forecast or other information supplied. You should always seek independent advice as to your suitability to speculate in any related markets and your ability to assume the associated risks, if you are at all unsure. We are not under any obligation to update any such material. Any opinion made may be personal to the author and may not reflect the opinion of StoneX Europe Ltd.