


Dow Jones Forecast: DJIA Nears All-Time Highs Once Again
As the new trading week kicks off, a renewed bullish bias is taking hold of the Dow Jones. The index has already rallied nearly 3.00% over the last 3 sessions, creeping back toward key all-time highs.
Share this:

As the new trading week kicks off, a renewed bullish bias is taking hold of the Dow Jones. The index has already rallied nearly 3.00% over the last 3 sessions, creeping back toward key all-time highs. Buying pressure remains strong, fueled by easing geopolitical tensions and falling bond yields, both of which have boosted market confidence. If these tailwinds persist, demand for the DJIA should remain solid in the coming sessions.


Short-Term Confidence Stages a Comeback
The week opened on an optimistic note as Middle East tensions cooled. The US decided to hold off on a new wave of strikes against Iran, while President Trump announced that negotiations would resume this Monday, hoping for concrete breakthroughs in the weeks ahead. If these talks gain traction, further military action could be off the table for now.
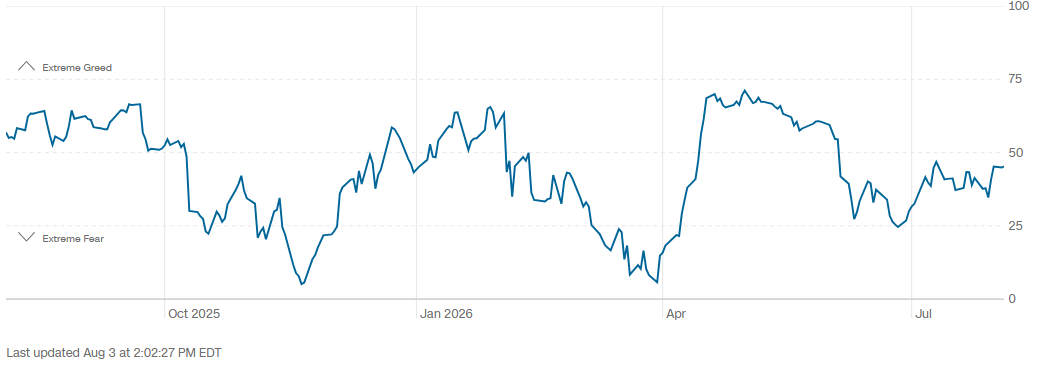
This diplomatic shift has worked wonders for market sentiment. The immediate reaction was visible in WTI crude, which dropped notably below the $80 mark, signaling a lower risk premium. This eases uncertainty and shifts appetite back toward risk assets while cooling the demand for safe havens. As a risk-on asset, Dow Jones is directly benefiting from this dynamic. The boost in confidence is already showing up in the Fear and Greed Index, which kicked off the week hovering around 45 points. This pushes the gauge back into "neutral" territory and out of "fear," confirming a mild but meaningful short-term recovery in sentiment.
Source: CNN
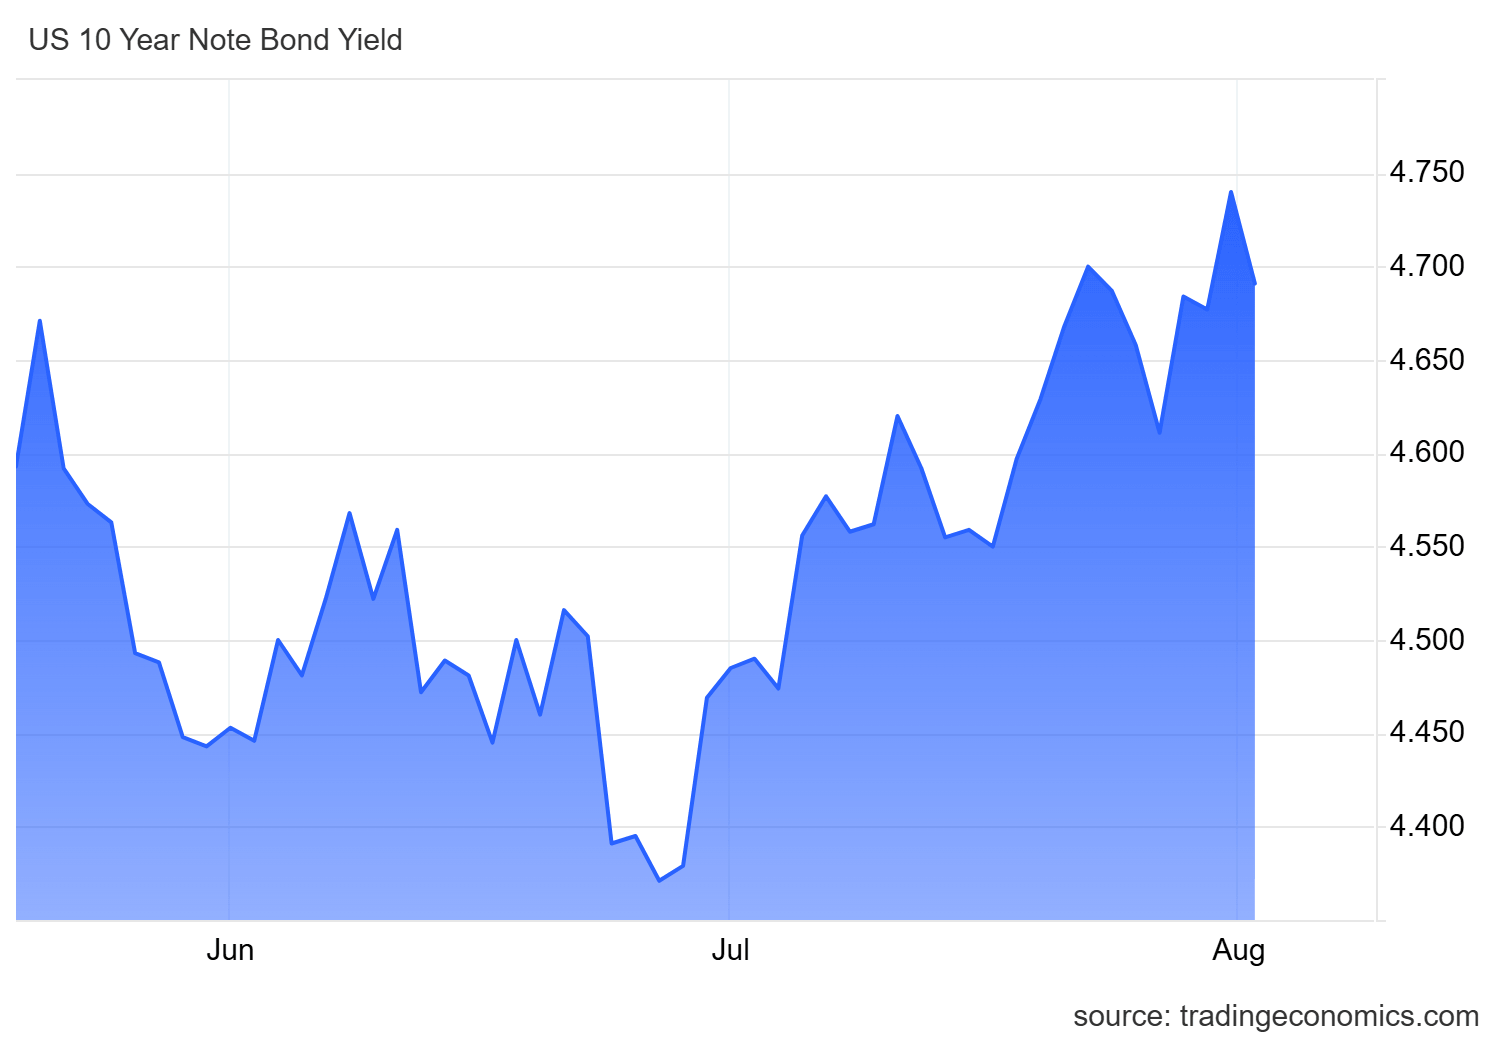
Bond market dynamics are also playing a major role, especially since fixed income often acts as a safe-haven alternative to Dow Jones. Following last week's Federal Reserve decision, the 10-year Treasury yield continues to slide from its 2026 peaks, now trading below 4.7%. This tells us that the bond market is losing some of its short-term yield appeal, freeing up capital for investors to explore alternatives like equities. A sustained drop in yields reduces the urge to park money in stable assets, paving the way for stronger demand for indices like the Dow Jones. On top of that, bonds are typically used as an inflation hedge, and the positive updates from the Middle East might be further dampening the appetite for these defensive plays.
Source: TradingEconomics
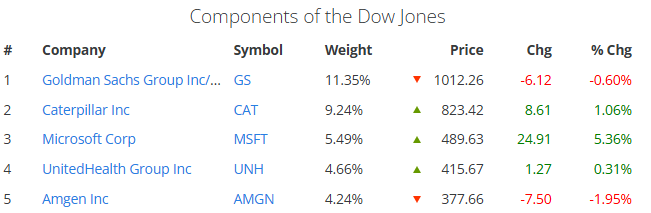
With this in mind, the heavyweights in the Dow Jones are holding up quite well. Among the top five most influential stocks in the index, only Amgen is seeing a notable dip of around -1.95%. The rest showing steady resilience, even ahead of tomorrow's Caterpillar earnings report. Strong performances from names like Microsoft, up 5.3% on the day, continue to underpin the index. This stability is largely driven by the short-term confidence boost, which has successfully snapped the losing streak that weighed on the stock market in recent weeks.
Source: SlickCharts
Moving forward, if falling bond yields and geopolitical optimism hold steady, the need to hide out in safe-haven assets will keep shrinking, leaving plenty of room for equity demand to thrive. This could keep the buying pressure on Dow Jones alive in the coming days. That said, solid corporate earnings are still a must, particularly from Caterpillar. If the index's top performers start flashing noticeable financial red flags, it could trigger a phase of hesitation that stalls the current confidence-driven rally.
Dow Jones Technical Outlook
Source: StoneX, Tradingview
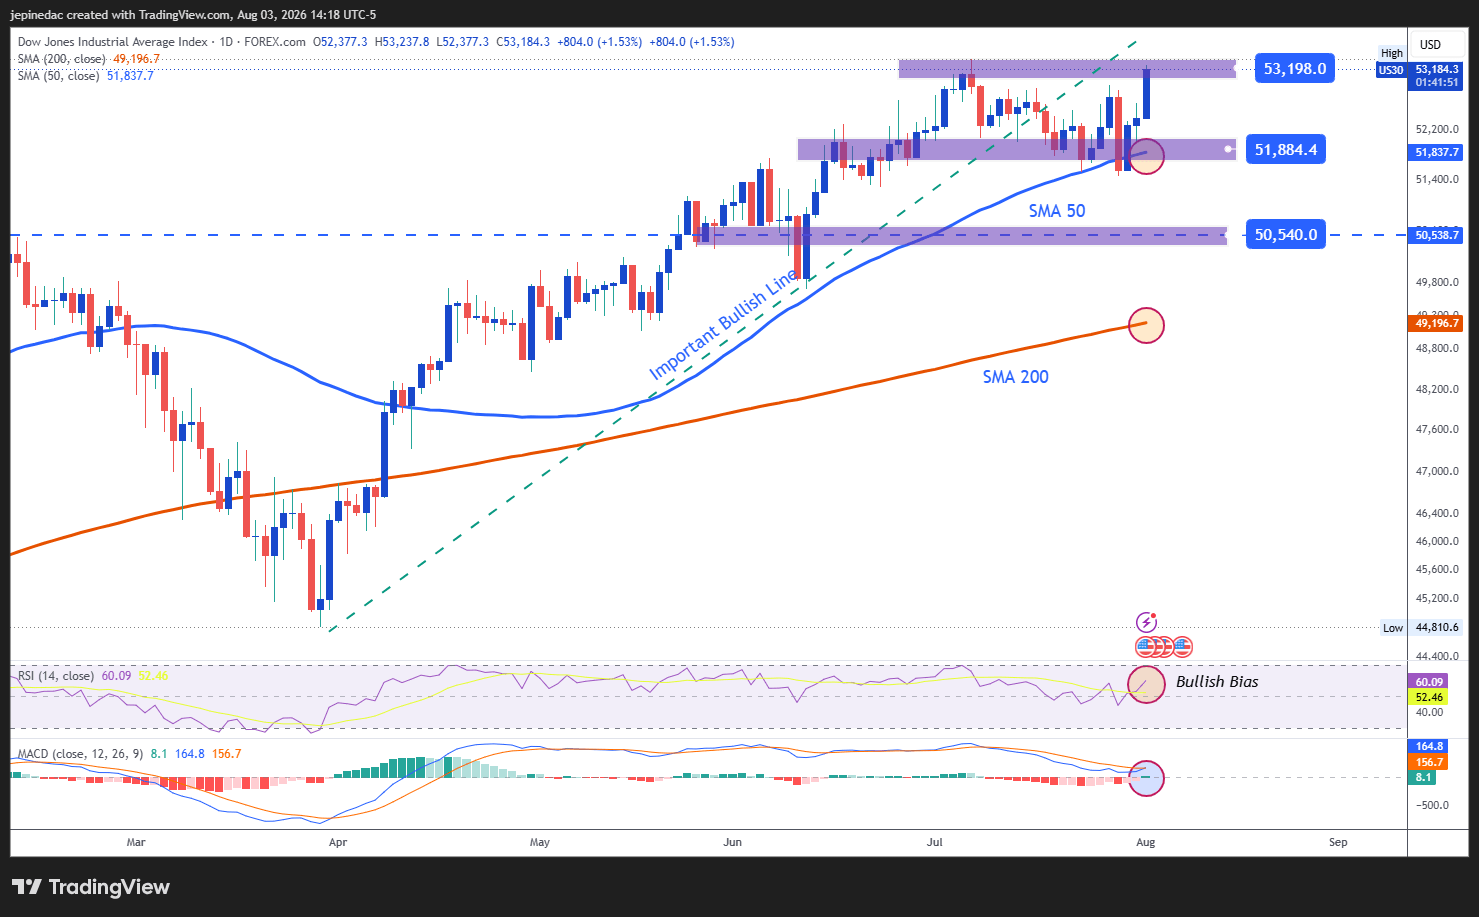
- Bullish momentum sets the tone: The recent price recovery has sparked significant short-term buying pressure. As Dow Jones approaches record highs, this renewed bullish bias could bring a previously relevant uptrend line back into play. If the momentum holds, this technical structure could firm up in the coming sessions.
- RSI: The RSI remains comfortably above the 50 level, reflecting dominant buying momentum over the last 14 sessions. If this holds, short-term bullish pressure should stay intact.
- MACD: However, the MACD histogram is hovering right near the 0 line. This suggests that short-term moving average momentum is in a holding pattern, meaning a slight undercurrent of indecision hasn't entirely left the chart.
Key Levels:
- 53,200 points (Key Resistance): The all-time high zone and the most critical bullish barrier on the chart. A decisive break above this level could unleash a stronger bullish bias and reactivate the uptrend line as the dominant pattern for the coming weeks.
- 51,800 points (Nearby Barrier): This level aligns with the 50-period simple moving average. If price action fails to break cleanly away from this zone, it could lead to persistent neutrality and potentially open space to a short-term sideways range.
- 50,500 points (Key Support): A former resistance zone from previous weeks, now sitting just below the 50-period moving average. A drop to this level could invite a more consistent bearish bias in the weeks ahead.
Written by Julian Pineda, CFA, CMT – Market Analyst
Follow him on: @julianpineda25
Related tags:
Latest market news




The complete CFD trading experience
Award-winning platforms, competitive spreads, low commissions and dedicated support.
We live and breathe the markets and are dedicated to helping traders realise their ambitions as we continue to set the industry bar.
Economic calendar
Web Trader platform
Our sophisticated web-based platform is packed with features.
Related articles

Dow Jones outlook: CPI, oil and yields put the rally to the test
US index futures rebounded in the first half of Wednesday’s session, along with European indices ahead of the release of US CPI. Some slightly dovish remarks from the Fed’s Williams seem to have helped sentiment a little, but whether those comments will be backed by data remains to be seen. While slightly hotter than expected inflation data shouldn’t be enough for markets to price in an October Fed hike with more than a coin flip probability, it can nonetheless reinforce expectations of further tightening later in the year.


Russell 2000 breaks 200-day average as CPI risk looms
US small caps have lost nearly 9% since August, with surging Treasury yields overwhelming a historically favourable midterm trading period. Now the Russell 2000 is threatening to break a major support zone ahead of US CPI.


Indices weekly outlook: Can the DAX rebound turn into a reversal?
Global indices managed to bounce back towards the end of the week as risk mood improved following Thursday’s drop in bond yields and a slight decline in oil prices. But by late Friday afternoon, oil prices had made back most of Thursday’s drop and the bond markets remained under some pressure as European bourses closed for trading.
StoneX Europe Ltd may make third party material available on this website which may contain information included but not limited to the conditions of financial markets. The material is for information purposes only and does not contain, and should not be construed as containing, investment advice and/or investment recommendation and/or an investment research and/or an offer of or solicitation for any transactions in financial instruments; any decision to enter into a specific transaction shall be made by the client following an assessment by him/her of their situation.
StoneX Europe Ltd makes no representation or warranty and assumes no liability as to the accuracy or completeness of the information provided, nor any loss arising from any investment based on a recommendation, forecast or other information supplied. You should always seek independent advice as to your suitability to speculate in any related markets and your ability to assume the associated risks, if you are at all unsure. We are not under any obligation to update any such material. Any opinion made may be personal to the author and may not reflect the opinion of StoneX Europe Ltd.