


Dow Jones Outlook: DJIA maintains confidence and breaks above the 48,000 level
With a two-session bullish streak, the Dow Jones index has posted a gain of more than 3.00% in the short term, once again showing a consistent bullish bias in recent price action.
Share this:

With a two-session bullish streak, the Dow Jones index has posted a gain of more than 3.00% in the short term, once again showing a consistent bullish bias in recent price action. For now, the recovery in confidence across risk assets appears to have settled into the market, and as the truce continues to ease uncertainty, buying pressure could remain relevant in the coming sessions.
However, it is important to note that while short-term confidence has improved consistently, the same cannot be said for long-term equity market sentiment, which remains a key factor to monitor in the weeks ahead.


Short-term confidence rebounds quickly
It has now been two days since the announcement of a two-week truce in the Middle East conflict, where the United States and Iran have opened the door for negotiations in the short term. This has allowed the risk perception linked to potential disruptions in the Strait of Hormuz to begin easing in recent sessions.
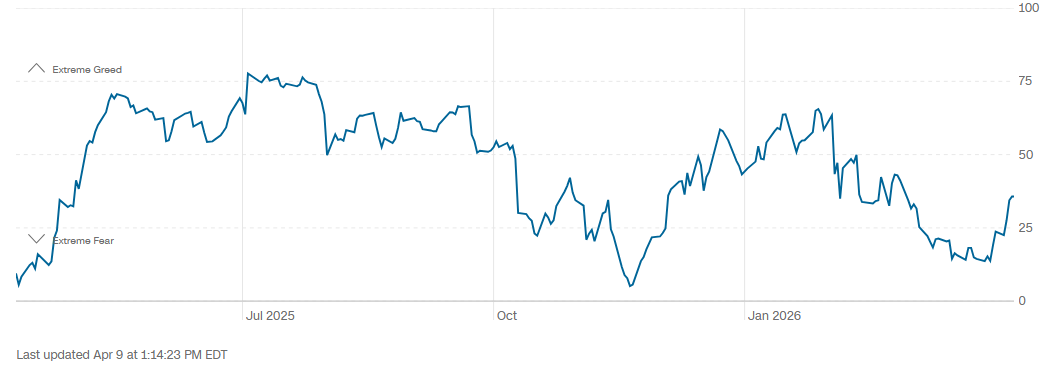
This effect has been clearly reflected in market sentiment indicators. The Fear and Greed Index has shown a consistent recovery, rising from around 14 points (extreme fear) to approximately 36 points, entering the “fear” zone. Although this does not represent a full recovery, it does signal an improvement in overall market sentiment, reducing demand for safe-haven assets and favoring renewed appetite for risk assets such as equities.
Source: CNN
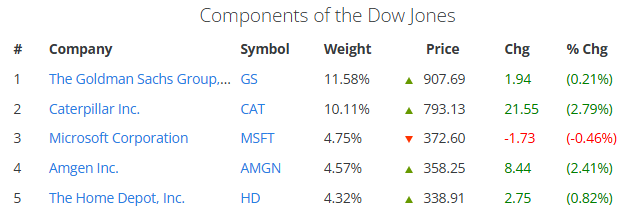
This improvement in confidence is also reflected in the main components of the Dow Jones. For instance, Goldman Sachs posted +0.21%, Caterpillar +2.79%, Amgen +2.41%, Home Depot +0.82%, while only one of the top five components showed losses, with Microsoft down -0.46%. This indicates that a large portion of the index is participating in the recovery, supporting sustained demand in the short term.
Source: Slickcharts
In this context, the temporary calm surrounding the Middle East conflict has allowed risk appetite to recover quickly, which could continue to support ongoing buying pressure in the Dow Jones in the coming sessions. However, this scenario depends heavily on the absence of new escalations that could bring risk aversion back into the market.
Long-term confidence improves but lags behind
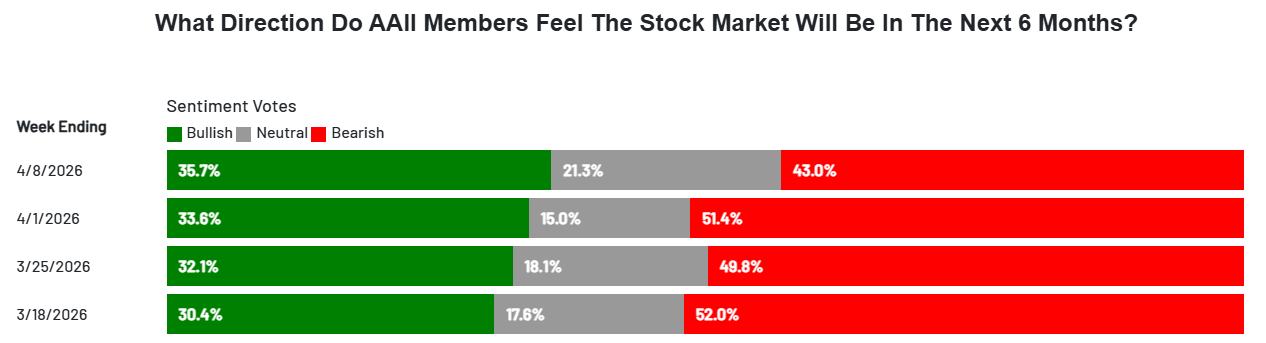
Another key factor to consider is how the market is assessing equity performance over the coming months. This can be observed through the AAII Investor Sentiment Survey, which reflects expectations for the next six months.
Although the latest data shows an improvement in optimism, rising to 35.7% from 33.6% the previous week, there is still a neutral reading of 21.3% and a bearish sentiment close to 43%, indicating that long-term confidence remains fragile.
Source: AAII
This environment is particularly relevant, as the lack of a more structural recovery in sentiment could limit the development of sustained demand in equity indices such as the Dow Jones. In this sense, unless long-term confidence shows stronger improvement, indecision may continue to play a role in price action despite the recent rebound.
Dow Jones Technical Outlook
Source: StoneX, Tradingview
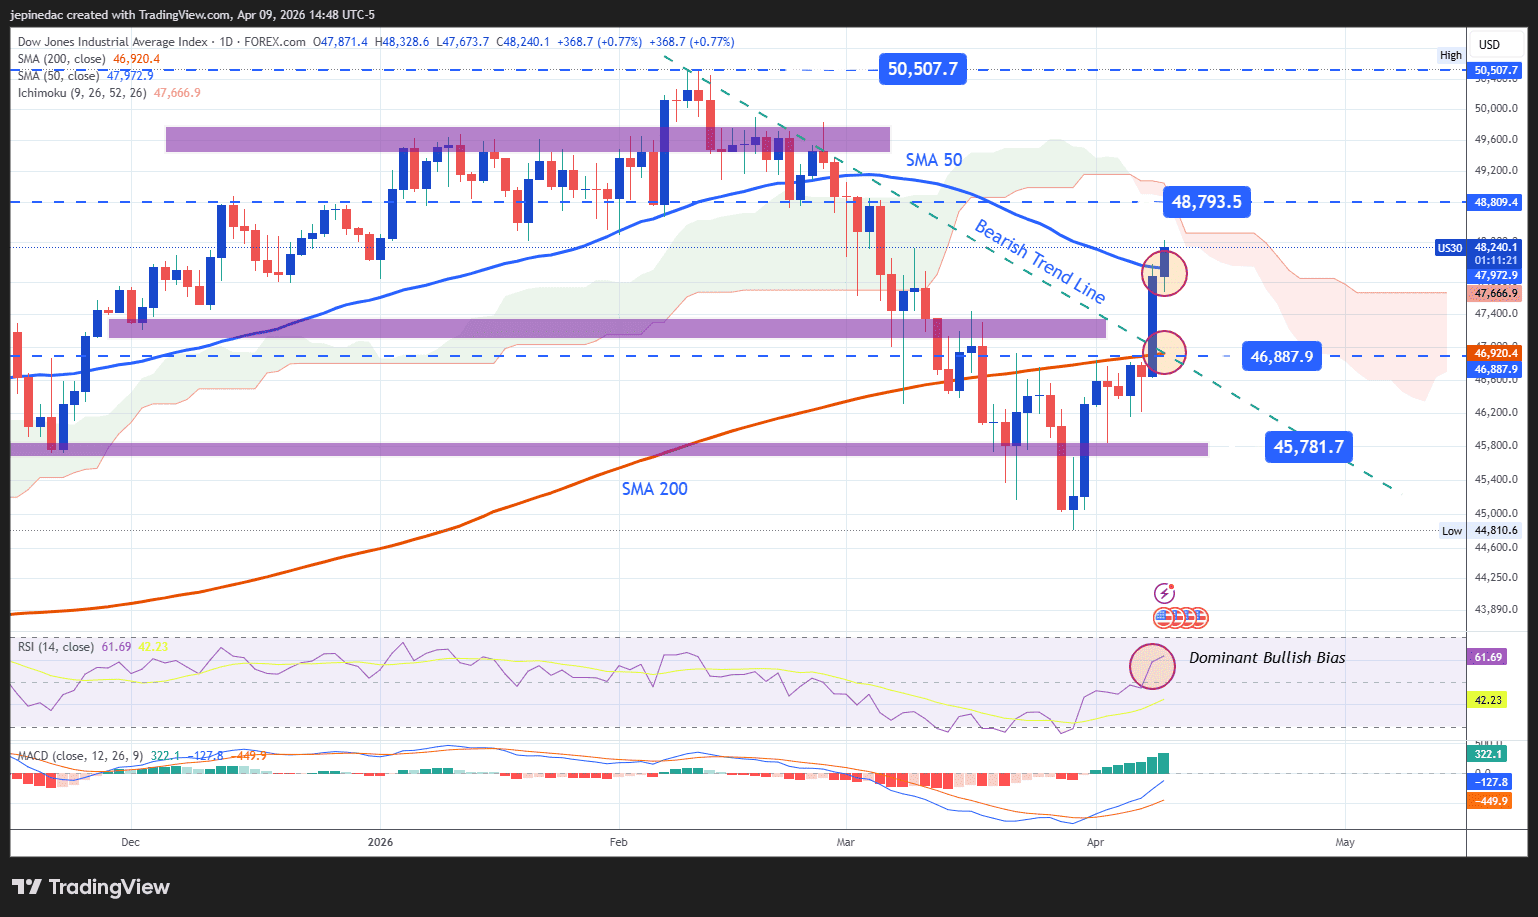
- Bullish momentum reshapes the structure: The recent recovery in the Dow Jones has been strong enough to break above a downtrend line that had been in place since early February, suggesting a potential shift in market structure. If bullish pressure continues, this could lead to the formation of a new short-term uptrend in the coming sessions.
- RSI: The indicator remains above the 50 level, signaling dominant buying momentum over the last 14 sessions. As long as this persists, buying pressure is likely to remain relevant in the short term.
- MACD: The MACD histogram is also positioned above the zero line, indicating that short-term moving average momentum has turned bullish. This supports the current upward bias if the behavior continues.
Key levels:
- 48,793 points – Key resistance: A recent high above the 50-period moving average. A move toward this level could reinforce a dominant bullish bias and support the continuation of an upward trend.
- 46,887 points – Near-term barrier: A level aligned with the 200-period moving average. Price action around this area could reinforce a range-bound or indecisive scenario in the short term.
- 45,780 points – Key support: A level not seen since November 2025, acting as the main downside barrier. A break below this zone could reactivate the bearish bias and bring back downside momentum.
Written by Julian Pineda, CFA, CMT – Market Analyst
Follow him on: @julianpineda25
Latest market news




The complete CFD trading experience
Award-winning platforms, competitive spreads, low commissions and dedicated support.
We live and breathe the markets and are dedicated to helping traders realise their ambitions as we continue to set the industry bar.
Economic calendar
Web Trader platform
Our sophisticated web-based platform is packed with features.
Related articles

Dow Jones outlook: CPI, oil and yields put the rally to the test
US index futures rebounded in the first half of Wednesday’s session, along with European indices ahead of the release of US CPI. Some slightly dovish remarks from the Fed’s Williams seem to have helped sentiment a little, but whether those comments will be backed by data remains to be seen. While slightly hotter than expected inflation data shouldn’t be enough for markets to price in an October Fed hike with more than a coin flip probability, it can nonetheless reinforce expectations of further tightening later in the year.


Russell 2000 breaks 200-day average as CPI risk looms
US small caps have lost nearly 9% since August, with surging Treasury yields overwhelming a historically favourable midterm trading period. Now the Russell 2000 is threatening to break a major support zone ahead of US CPI.


Dow Jones Forecast: DJIA cautious as oil jumps & earnings loom
U.S. stocks are subdued on Monday as investors weigh oil prices and geopolitical developments, while looking cautiously ahead to Q3 bank earnings and inflation data later in the week.

StoneX Europe Ltd may make third party material available on this website which may contain information included but not limited to the conditions of financial markets. The material is for information purposes only and does not contain, and should not be construed as containing, investment advice and/or investment recommendation and/or an investment research and/or an offer of or solicitation for any transactions in financial instruments; any decision to enter into a specific transaction shall be made by the client following an assessment by him/her of their situation.
StoneX Europe Ltd makes no representation or warranty and assumes no liability as to the accuracy or completeness of the information provided, nor any loss arising from any investment based on a recommendation, forecast or other information supplied. You should always seek independent advice as to your suitability to speculate in any related markets and your ability to assume the associated risks, if you are at all unsure. We are not under any obligation to update any such material. Any opinion made may be personal to the author and may not reflect the opinion of StoneX Europe Ltd.