



DXY, USDCAD Outlook: Are Rate Cut Bets Fully Priced In?
DXY, USDCAD Outlook: With the Fed and BOC decisions just hours away, markets appear to have priced in 25 bps cuts and a dovish bias. Key levels are in focus, but any policy surprises — especially from the Fed — could trigger fresh volatility and extend current trends.
Share this:

Key Events:
- Questions around whether markets have fully priced in expectations rise ahead of the FOMC meeting
- The U.S. Dollar Index (DXY) trades near its 2025 lows around 96.50
- USD/CAD remains above 1.37 as markets anticipate 25 bps rate cuts from both the Fed and the BOC
BOC and Fed meetings are under the spotlight today, both with 25 bos rate cut expectations, pricing in dovish pressured on the US Dollar index back towards the 2025 trough (96.50) and the USDCAD in a holding move above key support zone 1.37.
BOC in Focus: Growth, Labor, and Tariffs Cloud Outlook
Tariffs remain a major concern for central banks, including the Bank of Canada, as policymakers weigh their options carefully. Recent data tilts toward caution:
- Canadian GDP revisions showed Q1 falling to 1.6% and Q2 trimmed from 2.2% to 2.0%.
- Unemployment climbed to 7%, matching levels last seen in 2021.
- Inflation came in mixed, with CPI m/m at –0.1%, while both median and trimmed CPI hovered around 3.1%.
This soft data backdrop reinforces expectations for a 25 bps rate cut, bringing the BOC’s policy rate down from 2.75% to 2.50%.
Impact on USD/CAD: The pair maintains a stable hold above the 1.37 support zone, while FOMC-related pressures continue to build from the U.S. side.
The Fed Case: 25 bps Priced In, but 50 bps Speculation Lingers
Despite headlines leaning bearish, market structure and key technical levels take priority — particularly when expectations are already priced in. If the Fed delivers more dovish signals than expected, particularly in reference to labor market weakness, we may see another leg lower in the U.S. Dollar Index (DXY).
However, the monthly time frame structure on the U.S. Dollar Index chart continues to draw my attention due to the following key patterns:
DXY Outlook: Monthly Time Frame – Log Scale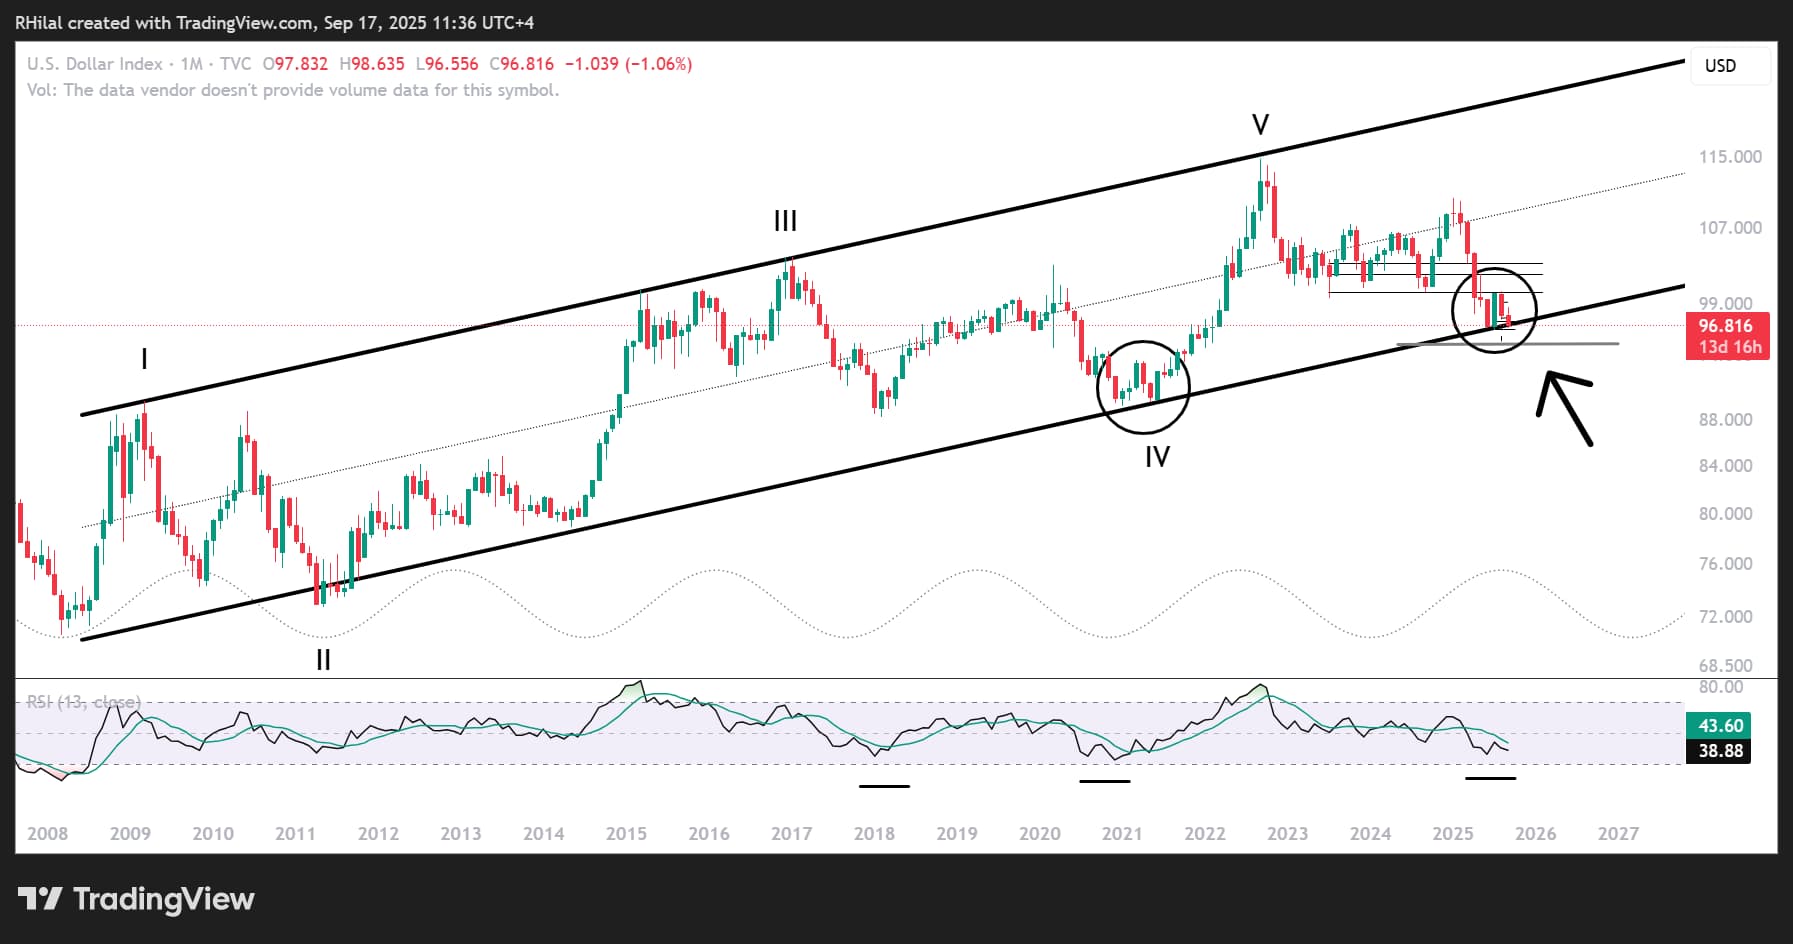 Source: Tradingview
Since 2008, the DXY has moved within a well-respected ascending parallel channel on the monthly time frame. The current price is testing the lower boundary of this 17-year structure, mirroring prior rebound setups — including:
- A bullish engulfing pattern
- Monthly RSI reaching historic oversold levels
This setup raises questions about the sustainability of the current downtrend and whether we’re near a reversal or breakout point.
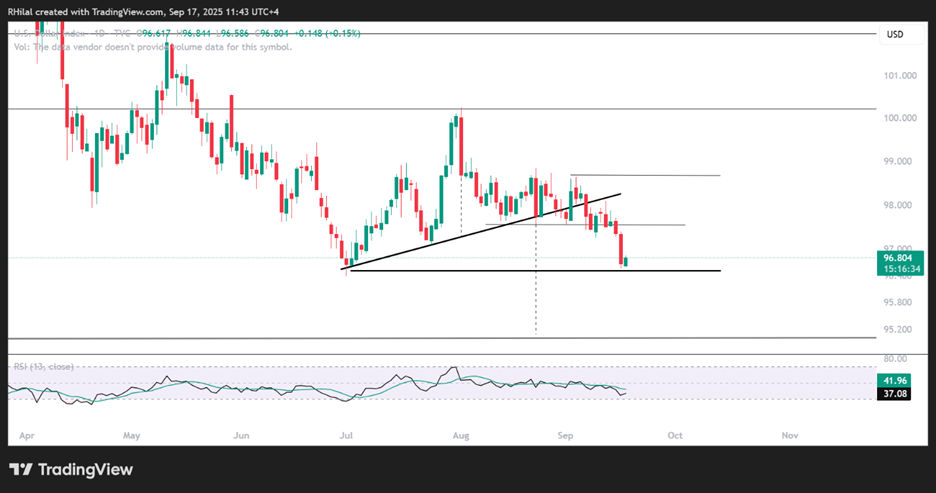
DXY Outlook: Daily Time Frame – Log Scale
Source: Tradingview
On the daily chart, DXY is forming a head and shoulders pattern, pointing toward 95.00, and potentially lower towards levels 92.00 and 89.00 (2021 trough).
However, unless a clear breakdown occurs, I’m still considering the possibility of a limited downtrend or a reversal. A rebound from the 96.50 support, followed by breaks above 97.50 and 98.50, would shift the bias back toward bullish.
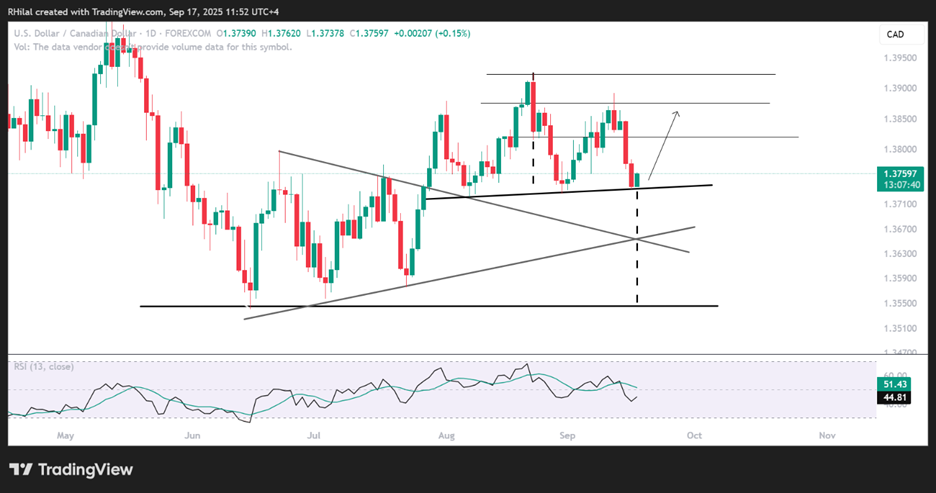
USDCAD Outlook: Daily Time Frame – Log Scale
Source: Tradingview
USD/CAD remains in neutral territory, with price consolidating below the 1.39 resistance since August. A potential head and shoulders pattern may be forming, but it requires a decisive break below 1.3720 to confirm, which could open the path toward the 2025 lows at 1.3650 and 1.3540.
On the upside, if the pair maintains support above 1.3760, we could see a move toward 1.3820, 1.3880, and 1.3920.
Written by Razan Hilal, CMT
Follow on X: @Rh_waves


The complete CFD trading experience
Award-winning platforms, competitive spreads, low commissions and dedicated support.
We live and breathe the markets and are dedicated to helping traders realise their ambitions as we continue to set the industry bar.
Economic calendar
Web Trader platform
Our sophisticated web-based platform is packed with features.
Related articles
NFP Preview: Can the Jobs Report Overcome the Bond Market Meltdown Too?
Traders and economists expect the NFP report to show that the US created 90K net new jobs, with average hourly earnings rising 0.3% m/m (3.1% y/y) and the U3 unemployment rate at 4.1% - see what the leading indicators are suggesting!

US Dollar Technical Outlook: DXY Bulls Meet Resistance at Yearly Highs 10 1 2026
The U.S. Dollar has held firm despite fading Fed hike bets, but Friday’s payrolls could test the rally’s staying power.


EUR/USD, GBP/USD Outlook: RSI Hits 2020 Oversold Levels
EUR/USD, GBP/USD Outlook: The EUR/USD daily RSI has fallen to oversold levels last seen in 2020, raising the risk of a reversal across correlated currency pairs, including the US dollar and GBP/USD.
StoneX Europe Ltd may make third party material available on this website which may contain information included but not limited to the conditions of financial markets. The material is for information purposes only and does not contain, and should not be construed as containing, investment advice and/or investment recommendation and/or an investment research and/or an offer of or solicitation for any transactions in financial instruments; any decision to enter into a specific transaction shall be made by the client following an assessment by him/her of their situation.
StoneX Europe Ltd makes no representation or warranty and assumes no liability as to the accuracy or completeness of the information provided, nor any loss arising from any investment based on a recommendation, forecast or other information supplied. You should always seek independent advice as to your suitability to speculate in any related markets and your ability to assume the associated risks, if you are at all unsure. We are not under any obligation to update any such material. Any opinion made may be personal to the author and may not reflect the opinion of StoneX Europe Ltd.