





EUR/JPY Prods the Neckline of a Mammoth Bearish Reversal Pattern
A potential bearish reversal pattern on EUR/JPY I flagged in December could be on the cusp of being confirmed. We just need the bearish follow through.
Share this:

View related analysis:
- Why I have my eyes on a bearish prize for EUR/JPY in 2025
- 2025 could be one heck of a ride if bearish AUD/JPY clues are correct
- Bullish-yen bets surge at record pace, USD outflows continue: COT report
View related analysis:
- Why I have my eyes on a bearish prize for EUR/JPY in 2025
- 2025 could be one heck of a ride if bearish AUD/JPY clues are correct
- Bullish-yen bets surge at record pace, USD outflows continue: COT report
In late December, I outlined my case for why EUR/JPY was my preferred short for 2025. From a high level, it continues to make sense. The Bank of Japan is veering towards further hikes to support the Japanese yen, alongside the risk-off flows that the Trump administration seemed destined to bring. Growth in Europe remains weak, and relations between its leaders and the Trump administration are frosty. And then there’s the issue of tariffs, and Trump strong-arming Europe into higher military spending in hopes NATO remains in place.
While I remain bearish on EUR/JPY, I cannot say with conviction that it will be the best short against the Japanese yen this year. Perhaps that will go to the Canadian dollar, which could be staring down the barrel of a recession with tariffs on the cusp of being implemented, despite upping their spending on border security at Trump’s request.
Still, price action clues very much remain bearish for EUR/JPY, a pair which appears on the brink of another leg lower.
EUR/JPY technical analysis
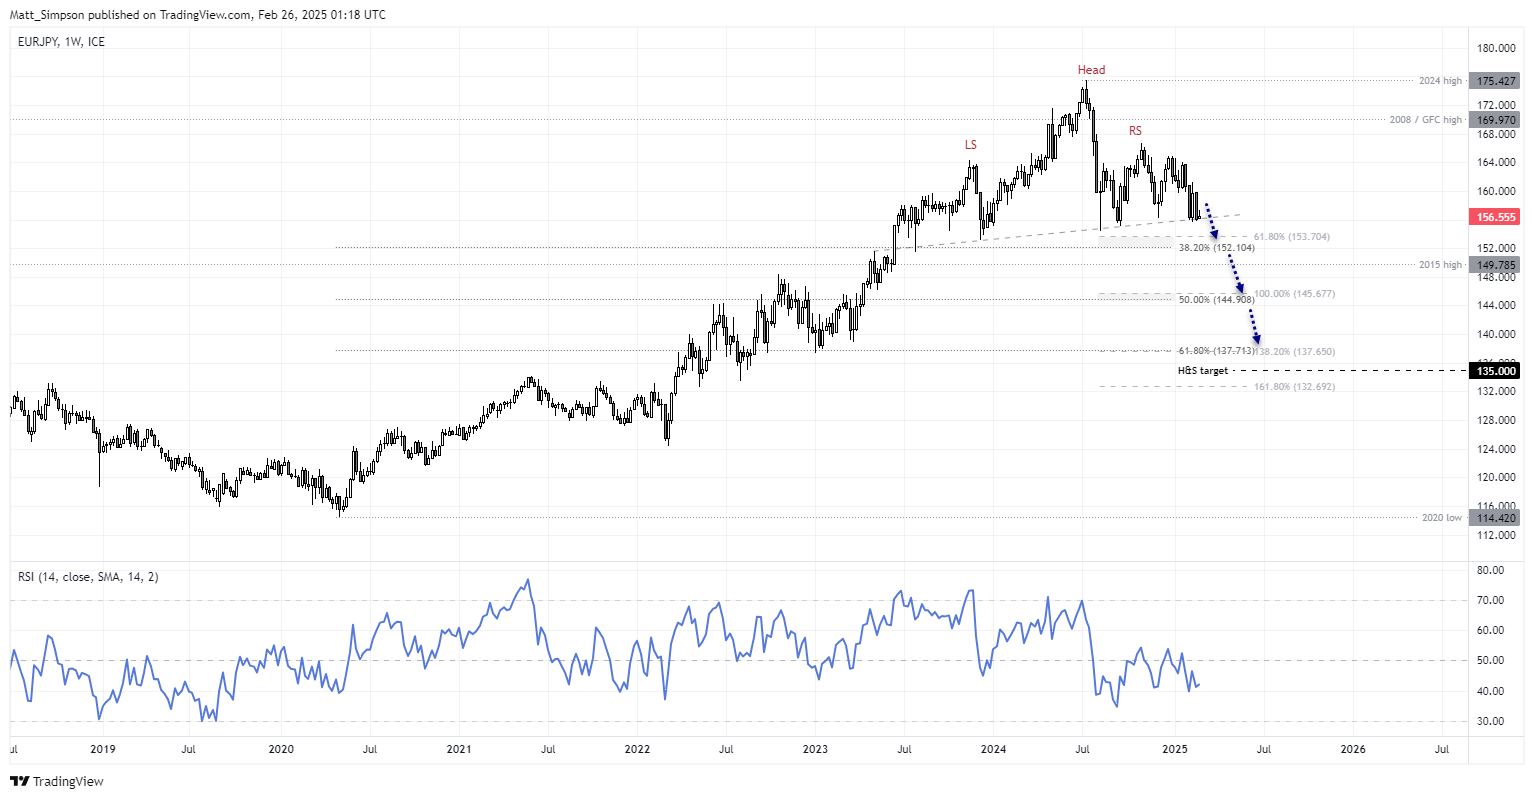
Prices are hugging the YTD low and in a very tight range this week. Prices are also just above holding above the neckline of a 1.5-year head and shoulders top, a bearish reversal pattern which suggests a downside target of 1.35 if successful. If that sounds far-fetched, it is only a -17% dop from this year’s high, and EUR/JPY managed annual ranges of ~18% in 2022 and 2023.
A break of the neckline could open up an initial run to 152, near a long-term 38.2% Fibonacci ratio. Though note that a 61.8% Fibonacci projection lands around 153.7. The 150 handle and 2015 high at 149.78 also seems like a likely support level along the way, alongside Fibonacci clusters around 145 and
137.50.
The one thing I do not like is the bullish divergence which is forming on the weekly RSI (14). But as it is not in the oversold zone, it likely warns of a potential shakeout along the way as opposed to a strong bullish reversal at this stage. And that makes EUR/JPY a pair for bears to consider fading into rallies this year.
EUR/JPY exposure from the COT report
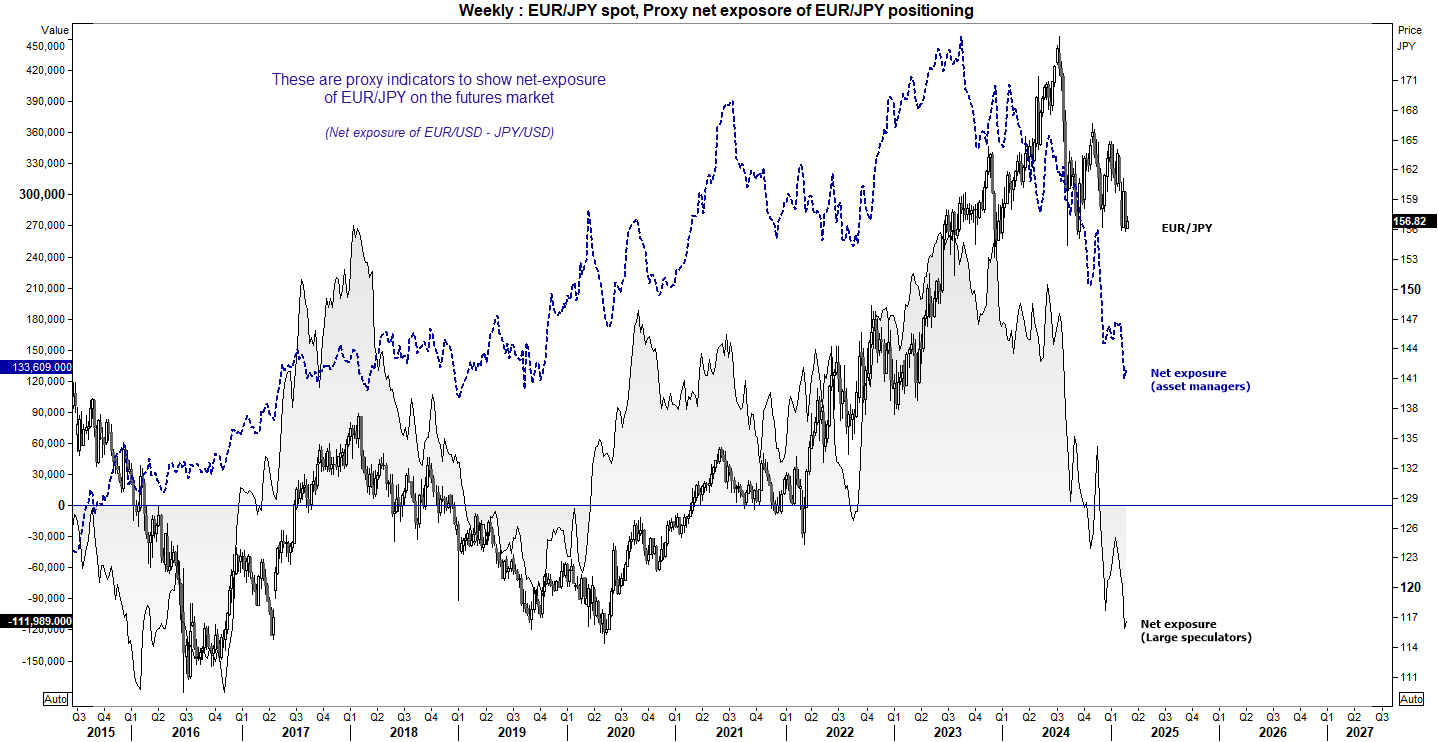
Market positioning on the futures market also points to a lower EUR/JPY. Instead of using the low-volumed EUR/JPY futures contract, I am simply looking at the spread between EUR/USD and JPY/USD exposure of asset managers and large speculators.
From this angle, my proxy EUR/JPY futures indicator shows that large speculators reached their highest level of net-short exposure in nine year two weeks ago, and asset managers reduced their net-long exposure to their least bullish level in six years the week prior.
It is almost as if they’re waiting for a 1.5-year bearish reversal pattern to spring into action.
-- Written by Matt Simpson
See more of Matt's analysis
See more of Matt's analysis
Follow Matt on Twitter @cLeverEdge
How to trade with City Index
You can trade with City Index by following these four easy steps:
- Open an account, or log in if you’re already a customer
• Open an account in the UK
• Open an account in Australia
• Open an account in Singapore
- Search for the market you want to trade in our award-winning platform
- Choose your position and size, and your stop and limit levels
- Place the trade
Related tags:
Latest market news



The complete CFD trading experience
Award-winning platforms, competitive spreads, low commissions and dedicated support.
We live and breathe the markets and are dedicated to helping traders realise their ambitions as we continue to set the industry bar.
Economic calendar
Web Trader platform
Our sophisticated web-based platform is packed with features.
Related articles
US Dollar, GBP/USD, USD/CAD, USD/CHF, Gold Weekly Technical Outlook 11 2 2026
Sr. Technical Strategist Michael Boutros highlights the levels that matter on the USD Majors, commodities, and equity indices charts this week.

US Midterm Forecast: The Key Risks for Traders to Watch Through the US Elections
Prediction markets are pricing in nearly 75% odds of a Democratic sweep in this week’s US midterm elections, a development that would result in a split from the single party Republican rule of the past two years - what will it mean for markets?


GBP/USD outlook: Currency Pair of the Week | November 2, 2026
The GBP/USD heads into a crowded week of event risk, with the midterm elections, a Bank of England rate decision and Friday's non-farm payrolls report all capable of moving markets sharply. The greenback remains fundamentally well supported by a hawkish Federal Reserve, but much of that is already priced in, while the renewed sell-off in technology stocks has exposed its vulnerability.

StoneX Europe Ltd may make third party material available on this website which may contain information included but not limited to the conditions of financial markets. The material is for information purposes only and does not contain, and should not be construed as containing, investment advice and/or investment recommendation and/or an investment research and/or an offer of or solicitation for any transactions in financial instruments; any decision to enter into a specific transaction shall be made by the client following an assessment by him/her of their situation.
StoneX Europe Ltd makes no representation or warranty and assumes no liability as to the accuracy or completeness of the information provided, nor any loss arising from any investment based on a recommendation, forecast or other information supplied. You should always seek independent advice as to your suitability to speculate in any related markets and your ability to assume the associated risks, if you are at all unsure. We are not under any obligation to update any such material. Any opinion made may be personal to the author and may not reflect the opinion of StoneX Europe Ltd.