



2025 could be one heck of a ride if bearish AUD/JPY clues are correct
As AUD/JPY is a classic barometer of risk, we should take note that all is not looking well around current levels. And if AUD/JPY tanks, it’s likely to be followed by risk in general.
Share this:

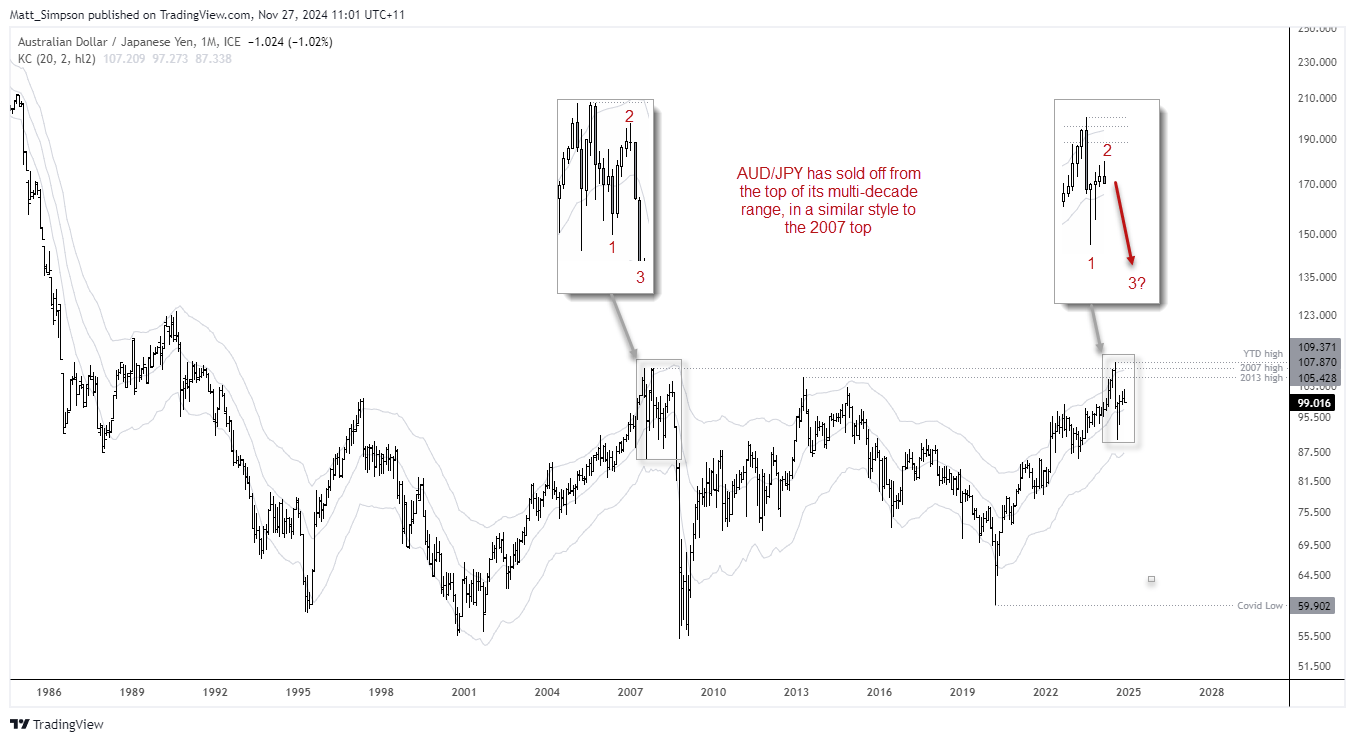
While AUD/JPY has already fallen by around 9% from its year-to-date high, it remains firmly in the top quartile of a sideways range that began in the mid-nineties. Focusing on this millennium, the cross has seen two significant tops in 2007 and 2013, both of which resulted in declines of over 40%, admittedly at different rates.
I am now questioning whether we’re on the cusp of a third significant top of the century, based on price action this year.
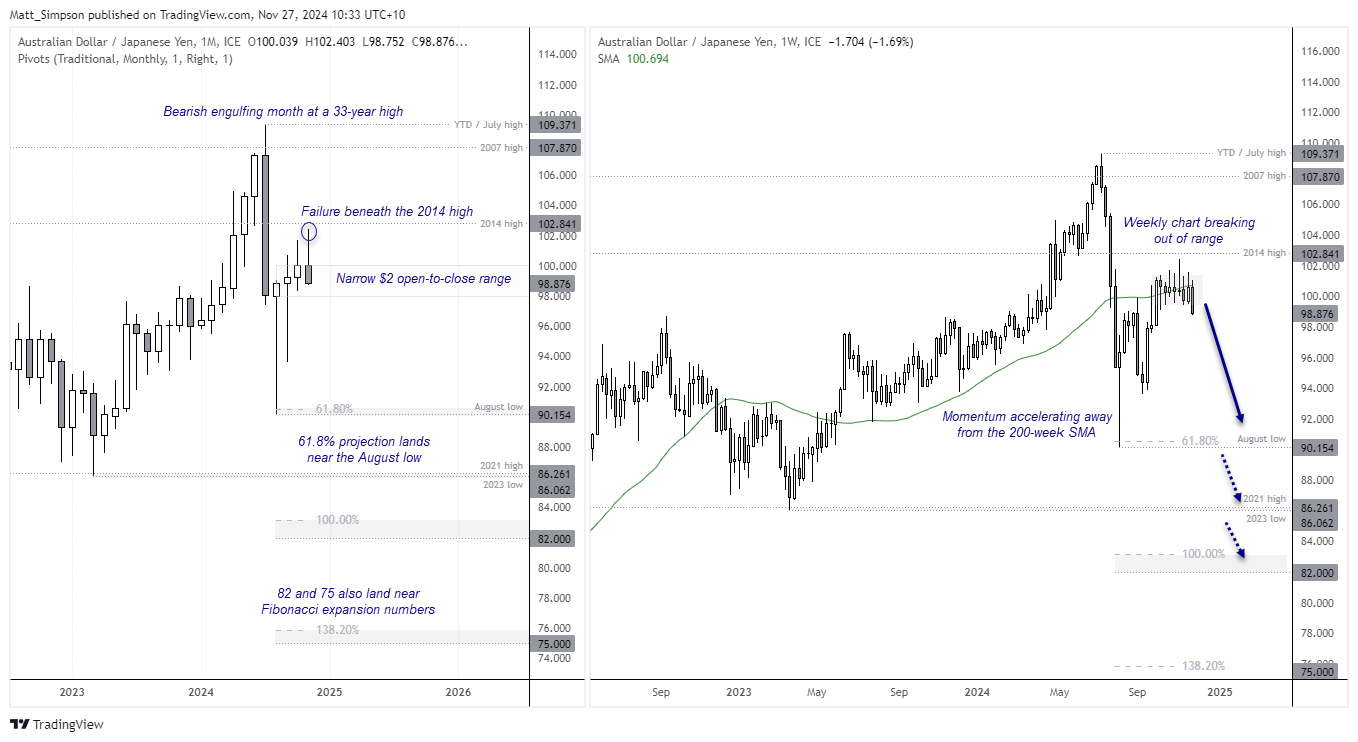
While prices reached a 33-year high in July, it was short-lived. Since then, prices tumbled around 18% before recouping some of those losses. Yet bulls are making hard work of gains and have only recouped around half of those losses over the past three and a half months.
Furthermore, the open-to-close range of the prior three months has been a mere ¥2 between 98 and 100. While there has been volatility either side of the open-to-close range, it has diminished each month. As volatility is bipolar, we could be nearing a phase of increased volatility.
Given we saw an aggressive bearish outside month in July followed by relatively weak gains over the next three months, I cannot help but compare it to the 1-2-3 move lower in 2007. And as that went on to see the market drop 48% due to the global financial crisis (GFC), the pattern has certainly piqued my interest.
But even if the market were to just drop 20% from its YTD high, it could still fall a further 1300 pips from current levels. And with Trump back at the helm next year, nothing is off the table in terms of market direction or levels of incoming volatility.
Note that the weekly chart is breaking out of a tight range and show momentum trying to break away from its 200-week SMA to the downside. Even a mere 61.8% projection could take AUD/JPY back to the August lows, whereas a 100% projection would see prices break beneath the 2023 low and land around 82.
And if AUD/JPY moves to such levels quickly enough, chances are it will mark a broad round of risk-off sentiment. I am not saying this is going to happen, but simply saying what I see on the charts. And for now, the charts suggest we could be on the cusp of a lot of downside for the classic barometer of risk.
-- Written by Matt Simpson
Follow Matt on Twitter @cLeverEdge
How to trade with City Index
You can trade with City Index by following these four easy steps:
- Open an account, or log in if you’re already a customer
• Open an account in the UK
• Open an account in Australia
• Open an account in Singapore
- Search for the market you want to trade in our award-winning platform
- Choose your position and size, and your stop and limit levels
- Place the trade
Related tags:

The complete CFD trading experience
Award-winning platforms, competitive spreads, low commissions and dedicated support.
We live and breathe the markets and are dedicated to helping traders realise their ambitions as we continue to set the industry bar.
Economic calendar
Web Trader platform
Our sophisticated web-based platform is packed with features.
Related articles
Forex & Gold Outlook: Dollar Dominates, Crosses Diverge
The US dollar rally gathers momentum as forex crosses develop contrasting technical setups. Matt Simpson examines eight FX markets and gold for potential trading opportunities.

Gold Outlook: Asia Buys the Dip, US Hammers the Rip
Asia buys the dip, the US sells the rip. Hourly gold, dollar and Treasury yield data reveal a regional divide that has become especially pronounced since September.


AUD/USD Bears Tighten Their Grip Into AU Jobs, RBA Minutes
AUD/USD falls below 68 cents as US dollar strength and peak RBA rate expectations put Australian jobs data and RBA minutes in focus.
StoneX Europe Ltd may make third party material available on this website which may contain information included but not limited to the conditions of financial markets. The material is for information purposes only and does not contain, and should not be construed as containing, investment advice and/or investment recommendation and/or an investment research and/or an offer of or solicitation for any transactions in financial instruments; any decision to enter into a specific transaction shall be made by the client following an assessment by him/her of their situation.
StoneX Europe Ltd makes no representation or warranty and assumes no liability as to the accuracy or completeness of the information provided, nor any loss arising from any investment based on a recommendation, forecast or other information supplied. You should always seek independent advice as to your suitability to speculate in any related markets and your ability to assume the associated risks, if you are at all unsure. We are not under any obligation to update any such material. Any opinion made may be personal to the author and may not reflect the opinion of StoneX Europe Ltd.