




EUR/USD could reclaim 1.11 if ISM manufacturing sinks further
If ISM manufacturing deteriorates further, it could helped EUR/USD reclaim the 1.11, handle, even if the weekly timeframe looks like it can still move lower beyond any such bounce.
Share this:

ISM manufacturing data is released today for August, and I’m intrigued to see if we see a further deterioration in the sector. If so, it could bolster EUR/USD for a cheeky run for 1.11, even if the weekly timeframe looks like it can still move lower beyond any such bounce.
Last month I noted that the report contained some of the most deflationary and pre-recessionary comments I had seen from respondents in quite some time.
The headline ISM figure of 46.8 marked its fastest pace of contraction in eight months, new orders also contracted. But perhaps more worryingly, the employment component tanked at its fastest pace since June 2020. Given markets are on high alert for weaker employment data ahead of Friday’s NFP, it might have an amplified effect on sentiment should employment tank further.
However, the ISM services report on Wednesday could carry more weight on the even of NFP. Especially if it contracts alongside manufacturing. However, perhaps the bigger potential move for the USD this week is if incoming data surprises to the upside overall. ISM services did just that last month, expanding at 51.4.
Ultimately, the euros direction likely lays in the hands of incoming US data. Where a rally for EUR/USD likely requires US data to come in softer than expected, whereas bears need it to come in weaker than expected.
EUR/USD technical analysis:
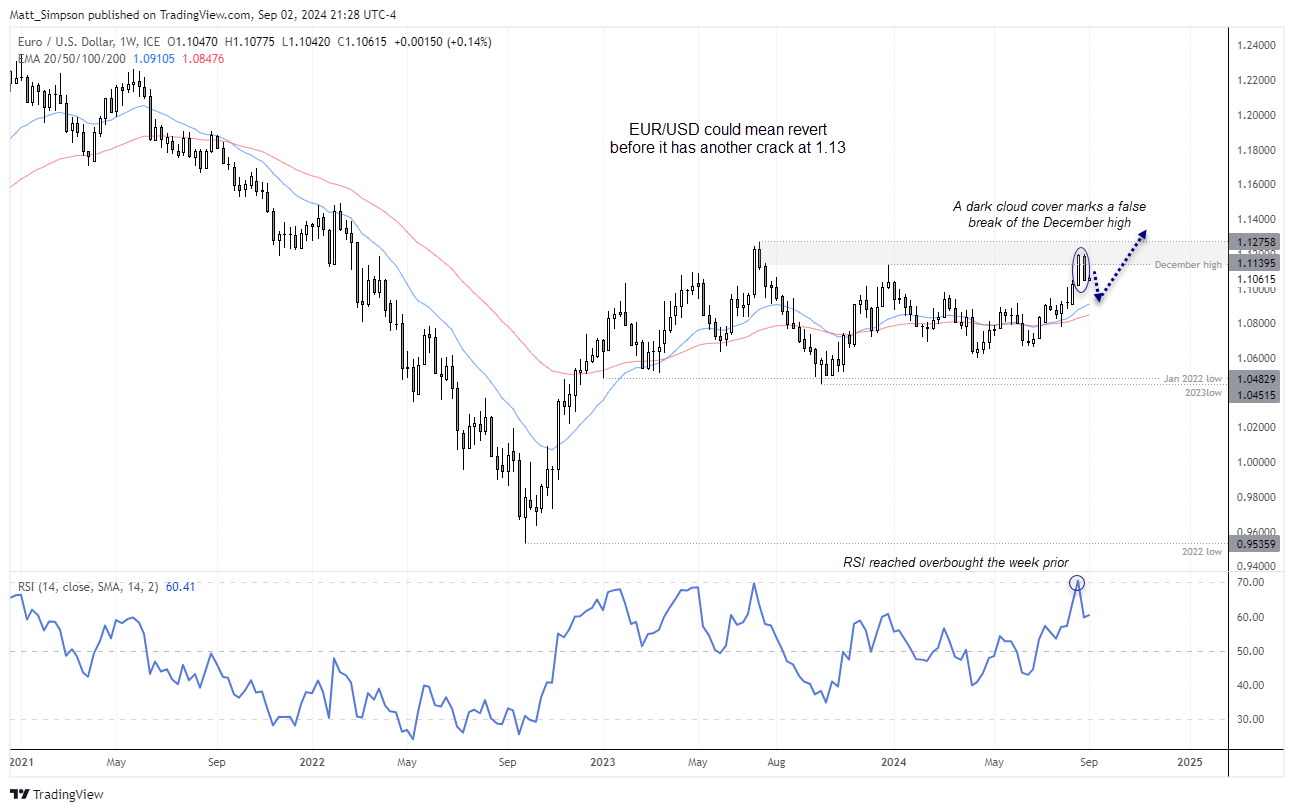
The euro’s rally came failed to hold above the December high last week, which saw the pair form a two-week bearish reversal pattern (dark cloud cover). The prior week’s high also coincided with the RSI (14) reaching overbought. If US data does outperform expectations relative to that of the eurozone’s, we could be looking at a lower EUR/USD over the coming weeks – even if it is simply part of a retracement lower before EUR/USD has another crack at 1.13.
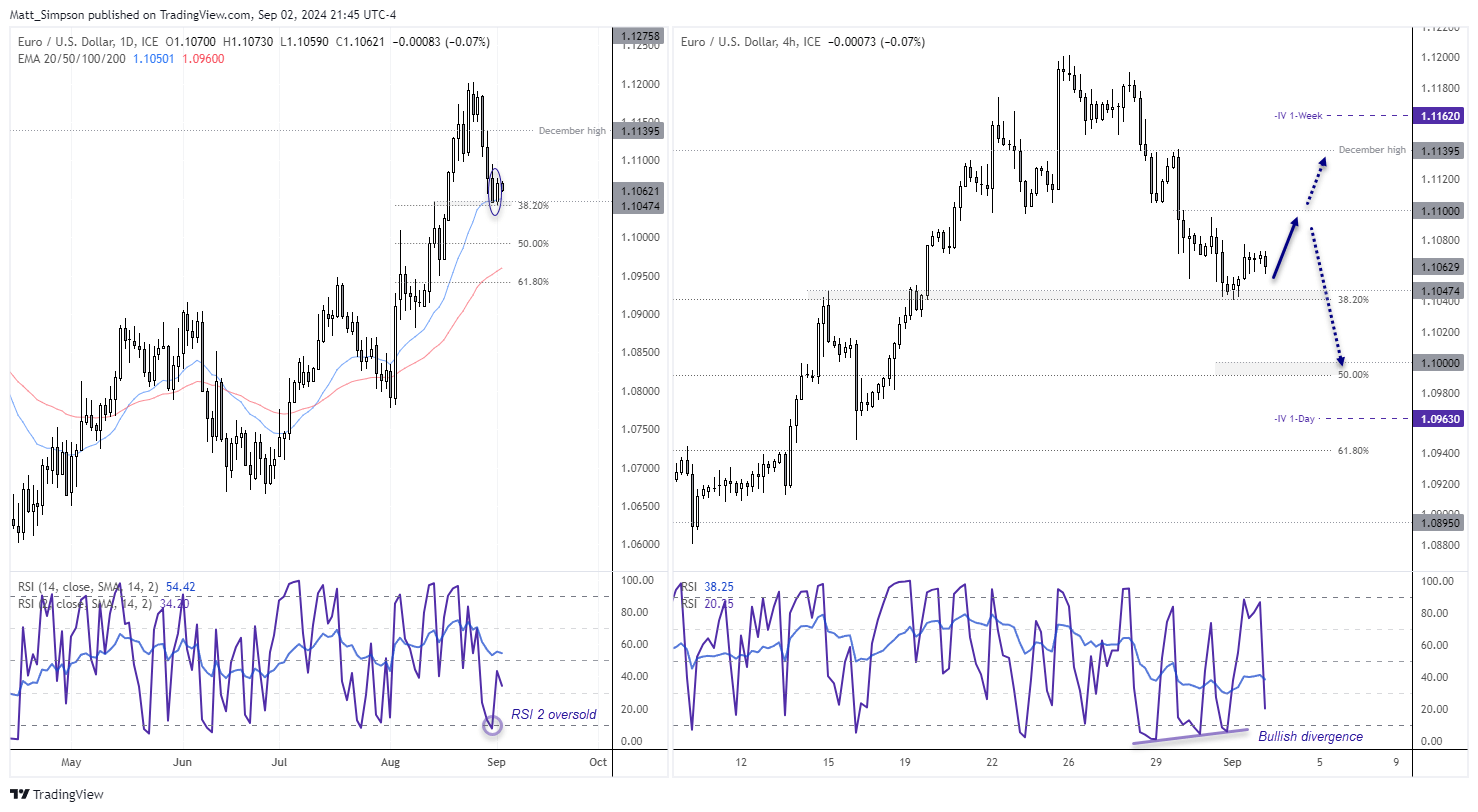
However, the daily chart appears primed for at least a small bounce. Monday’s small bullish candle formed part of a 2-bart bullish reversal (piercing line), around a 38.2% Fibonacci level and 20-day EMA. Prices are holding within the upper half of Monday’s range which further suggests demand above Monday’s low. Bulls could seek longs within Monday’s range for an initial move up to 1.1100.
We could then revisit its potential to extend gains, or form a swing high as part of a deeper countertrend correction.
-- Written by Matt Simpson
Follow Matt on Twitter @cLeverEdge
How to trade with City Index
You can trade with City Index by following these four easy steps:
- Open an account, or log in if you’re already a customer
• Open an account in the UK
• Open an account in Australia
• Open an account in Singapore
- Search for the market you want to trade in our award-winning platform
- Choose your position and size, and your stop and limit levels
- Place the trade
Related tags:


The complete CFD trading experience
Award-winning platforms, competitive spreads, low commissions and dedicated support.
We live and breathe the markets and are dedicated to helping traders realise their ambitions as we continue to set the industry bar.
Economic calendar
Web Trader platform
Our sophisticated web-based platform is packed with features.
Related articles
USD/CAD shooting star puts September surge on notice
USD/CAD has printed a clear bearish reversal pattern after an extraordinary September surge, but confirmation may depend heavily on how US Treasury yields react to Friday’s payrolls report.

USD/MXN Analysis: Is Super Peso Starting to Fade?
Over recent trading sessions, the Mexican peso has continued to show signs of weakness against the U.S. dollar. This can already be seen in USD/MXN, which has gained more than 1.7% over the last three sessions, highlighting sustained buying pressure in favor of the dollar in the short term.


Canadian Dollar Analysis: USD/CAD Returns to July Highs Ahead of NFP
The Canadian dollar continues to face one of its most challenging environments in recent months when it comes to maintaining strength against the U.S. dollar. The weakness of the Canadian currency is clearly reflected in USD/CAD, which has now recorded nine consecutive bullish sessions and gained more than 1.7% during that period.
StoneX Europe Ltd may make third party material available on this website which may contain information included but not limited to the conditions of financial markets. The material is for information purposes only and does not contain, and should not be construed as containing, investment advice and/or investment recommendation and/or an investment research and/or an offer of or solicitation for any transactions in financial instruments; any decision to enter into a specific transaction shall be made by the client following an assessment by him/her of their situation.
StoneX Europe Ltd makes no representation or warranty and assumes no liability as to the accuracy or completeness of the information provided, nor any loss arising from any investment based on a recommendation, forecast or other information supplied. You should always seek independent advice as to your suitability to speculate in any related markets and your ability to assume the associated risks, if you are at all unsure. We are not under any obligation to update any such material. Any opinion made may be personal to the author and may not reflect the opinion of StoneX Europe Ltd.