




Euro Technical Analysis: EUR/USD Holding Resistance, Bears Not Able to Run Yet
Deduction can be a powerful tool in trading and analysis and, at this point, there’s been a continued failure from bulls to drive fresh highs in EUR/USD, leading to stall in DXY bearish trends.
Share this:

Euro, EUR/USD Talking Points:
- The US Dollar has had an open door to break down over the past few weeks yet it hasn’t been able to do much on tests of fresh lows, leading to the build of a falling wedge.
- The DXY’s largest constituent of EUR/USD has similarly had an open door to prod a strong breakout yet there’s been a continued hold of resistance around the 1.1200 handle, thereby keeping the door open for continuation of the longer-term range in the pair.
- I’ll be discussing these setups in-depth in the weekly webinar: Click here for registration information.
Deduction can be a powerful tool in trading and analysis. When something should happen or looks like it probably will happen – and then doesn’t – there’s probably a reason for it. This is why the old saying goes ‘when a stock fails to go up on good news, look out below.’
The reason in many cases has to do with sentiment, or positioning. Because news and headlines do not perfectly push price. The only thing that can push prices in a true market is buyers and sellers, supply and demand. And if everyone willing and able to be long already is, even the greatest news report in the world can’t compel prices to push higher because there’s nobody left to buy. The very act of stall in the face of that good news could cause discomfort in longs, leading some to jump ship, and then we have supply in the market that will lead to lower prices.
This has been somewhat of the case in the US Dollar over the past few weeks. The Fed went 50 bps on the cut to lean dovish. And they highlighted their expectation for even more cuts into the end of the year. On the news, the US Dollar was able to flex down to a fresh yearly low but, suddenly, selling pressure stalled and prices began to reverse.
Last week saw a chorus of dovish Fed-speak hit the airwaves, with a continued look towards more and more rate cuts. But, again, USD bears continued to stall at prints or tests of fresh lows.
This isn’t to say that there lacks motive or reason for Dollar-bears to make a push. USD/JPY, for example, could have more carry trade left to unwind. And for the first two months of Q3 this was a dominating factor in currency markets. We saw a shocking response on Friday on the back of Japanese elections, even with the incoming PM saying that he plans to lean on ‘loose monetary policy.’ That move-lower in USD/JPY continued into this week until the 141.69 swing came into the picture to provoke a bounce.
But perhaps more key to the USD’s stall has been what’s shown in EUR/USD over the past month. The pair had a bullish first two months of Q3 until the 1.1200 level came into play in late-August. And as we wind down Q3 that resistance remains in-play today.
EUR/USD Daily Price Chart
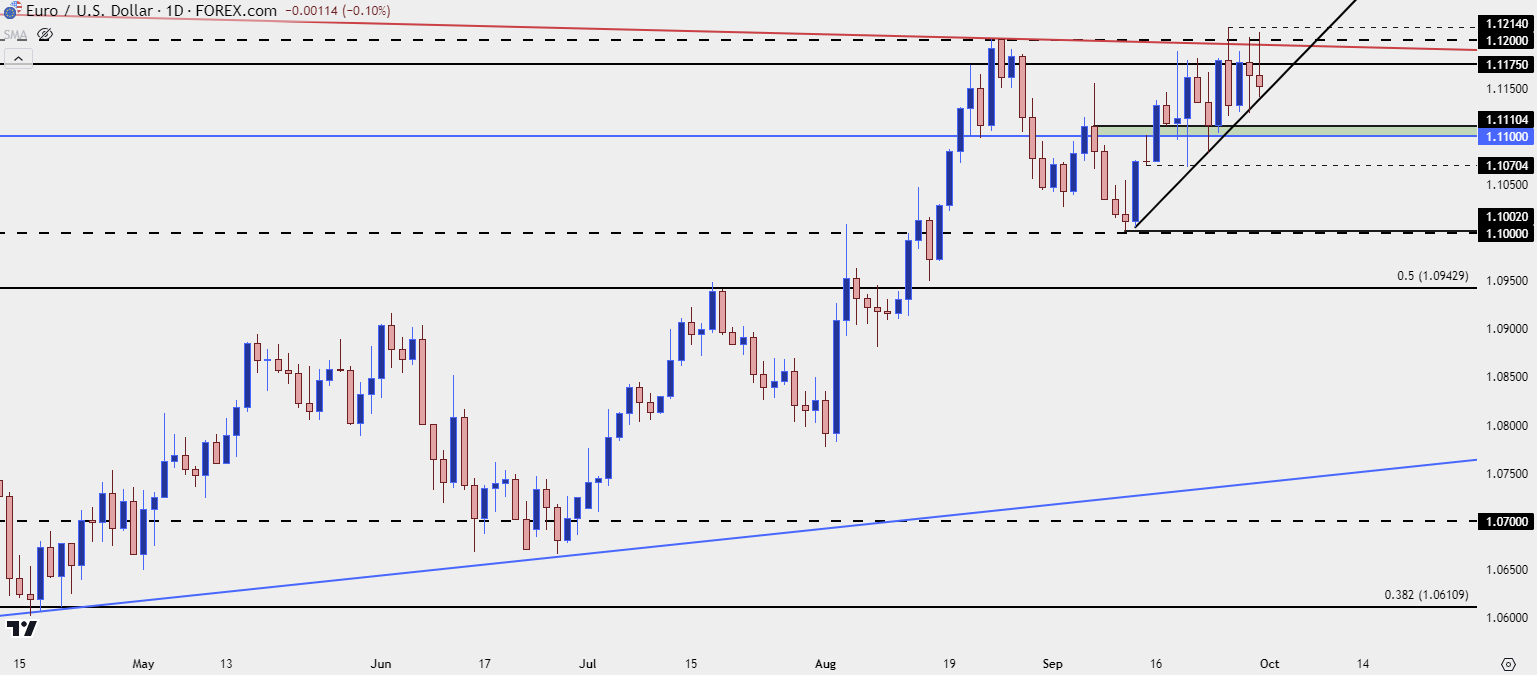 Chart prepared by James Stanley, EUR/USD on Tradingview
Deducing Deduction
At this point EUR/USD bears have pretty much only been able to hold back bullish breakouts. From that August resistance inflection at 1.1200, there was a downward trend that lasted for a few weeks. But, bulls came in to hold support just above the 1.1000 handle (2 pips above, to be exact), and this led to a rally that held through the Fed’s rate cut.
But that rally initially stalled inside of the 1.1200 highs, with 1.1175 holding the line. And then last week, amidst the dovish Fed-speak and a speech from US Treasury Secretary, Janet Yellen, another wave of weakness hit the Greenback and this time, EUR/USD bears were able to push above 1.1200, albeit slightly.
At that point, another level of interest came into play from longer-term charts, with the 61.8% retracement of the ‘lifetime move’ in the pair coming in to hold the highs. Another brisk reaction showed from there but, again, bears couldn’t take advantage of the move to drive down to fresh lows.
EUR/USD Monthly Price Chart
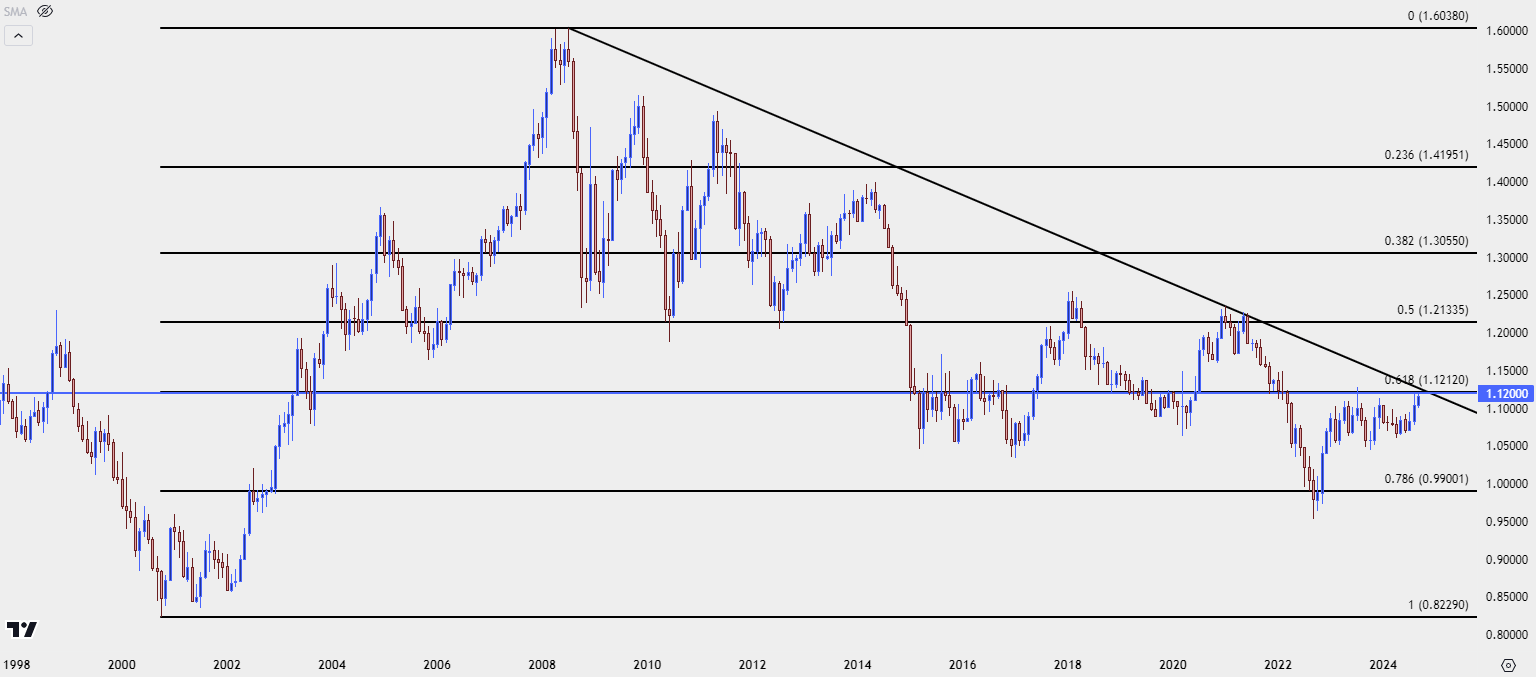 Chart prepared by James Stanley, EUR/USD on Tradingview
And again, so far this week, that rush of USD-weakness on the back of USD/JPY breaking further down pushed another 1.1200 test in EUR/USD but the pair has continued to show stall.
From the daily chart below we can see where price action is growing tighter and tighter with continued resistance holding around 1.1200 to go along with higher-lows. Bulls have been active on tests of support thus far which is what’s led to this bullish trendline after the 1.1000 bounce. But, to date, they haven’t been able to run with breakouts and this is a big part of that stalling that’s so far shown in DXY.
EUR/USD Daily Price Chart
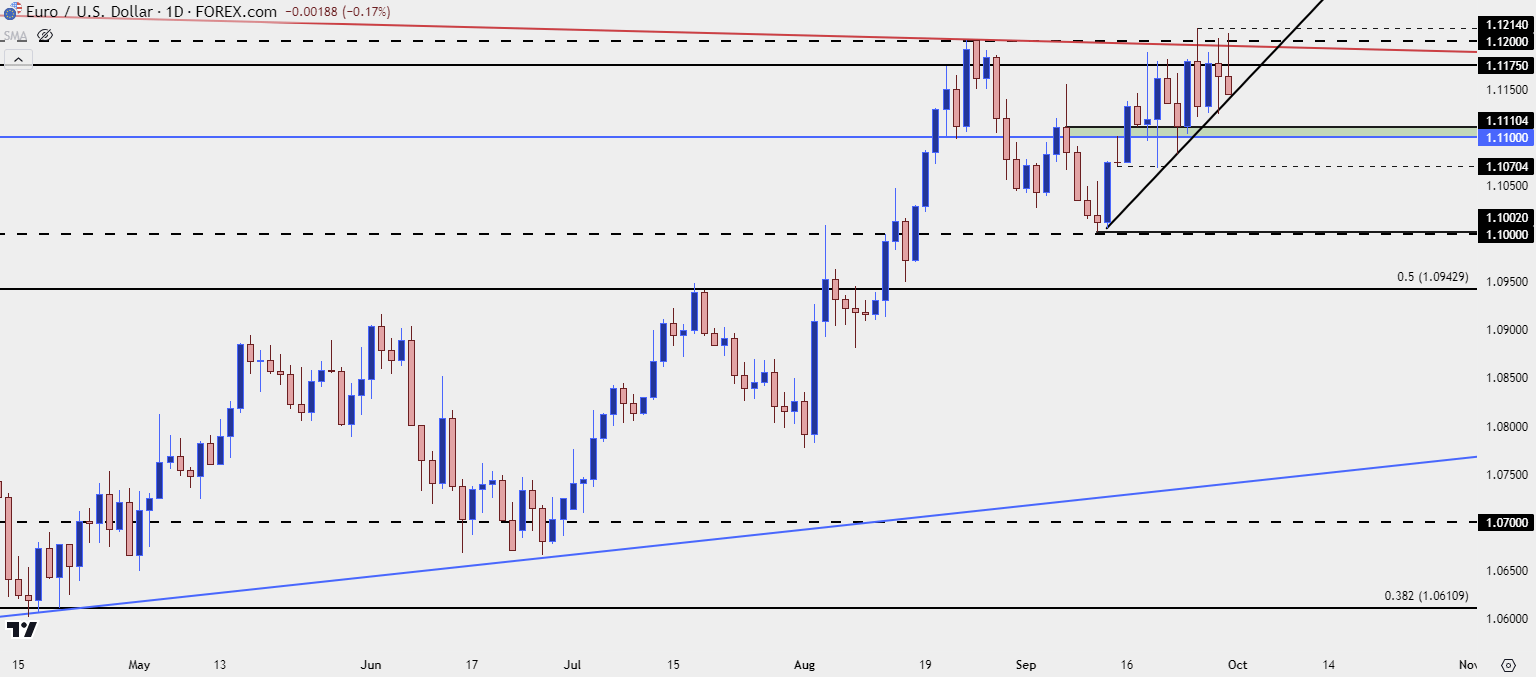 Chart prepared by James Stanley, EUR/USD on Tradingview
What Comes After Deduction?
For this to turn into a legitimate turn we’re going to need to see some continued change from bears. They can defend resistance – but can they overmatch bulls on tests of higher-lows to finally take control of near-term price action? That’s been the missing ingredient to a larger turn so far and that’s what I’m watching for this week.
As of this writing, there’s a test at a big spot of 1.1140, which is a prior swing high that’s confluent with the shorter-term trendline taken from the 1.1000 bounce in the pair. Sellers driving below that would be a big first step. After that, there’s the swing-low from Wednesday of last week at 1.1122, and you can see from the lower wicks on the candles that followed that low last week, there was an element of bullish anticipation. Bears are going to need to chew through that, as well.
If they can make it below 1.1100, that would be indication of increasing anticipation, at which point a bounce to a lower-high could be an attractive variable, with focus on any of the aforementioned support levels as possible resistance, and we could even add on 1.1155 and 1.1175 for that.
The major test for sellers in that scenario is the same 1.1000 level that thwarted bears ahead of the ECB’s rate cut a few weeks ago. If sellers can take that out, the longer-term range looked at above will look more attractive for continuation and, in-turn, bounce scenarios in the US dollar will take on greater attraction, as well.
EUR/USD Four-Hour Price Chart
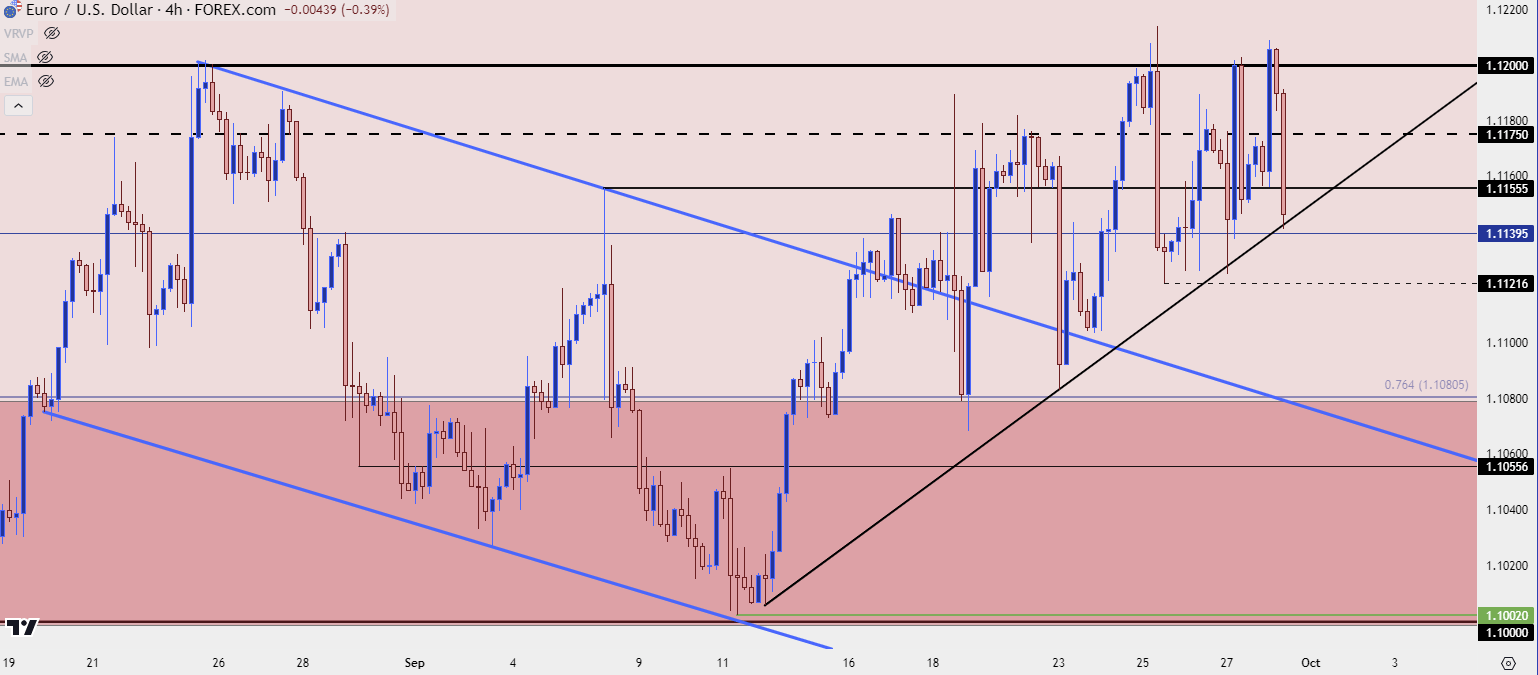 Chart prepared by James Stanley, EUR/USD on Tradingview
What if the USD Does Break Down?
I’ve talked about this at-length of late because frankly we cannot rule it out. All that we have at this point is deduction that sellers haven’t yet been able to run a break. But – if we do get that scenario, I think there are simply greener pastures elsewhere, in a pair with a currency not being pushed lower by greater rate cut expectations. This keeps the door open for bullish continuation scenarios in GBP/USD or AUD/USD, both of which have been able to set fresh yearly highs while driving topside trends even as the US Dollar has held within the range.
--- written by James Stanley, Senior Strategist
Euro, EUR/USD Talking Points:
- The US Dollar has had an open door to break down over the past few weeks yet it hasn’t been able to do much on tests of fresh lows, leading to the build of a falling wedge.
- The DXY’s largest constituent of EUR/USD has similarly had an open door to prod a strong breakout yet there’s been a continued hold of resistance around the 1.1200 handle, thereby keeping the door open for continuation of the longer-term range in the pair.
Deduction can be a powerful tool in trading and analysis. When something should happen or looks like it probably will happen – and then doesn’t – there’s probably a reason for it. This is why the old saying goes ‘when a stock fails to go up on good news, look out below.’
The reason in many cases has to do with sentiment, or positioning. Because news and headlines do not perfectly push price. The only thing that can push prices in a true market is buyers and sellers, supply and demand. And if everyone willing and able to be long already is, even the greatest news report in the world can’t compel prices to push higher because there’s nobody left to buy. The very act of stall in the face of that good news could cause discomfort in longs, leading some to jump ship, and then we have supply in the market that will lead to lower prices.
This has been somewhat of the case in the US Dollar over the past few weeks. The Fed went 50 bps on the cut to lean dovish. And they highlighted their expectation for even more cuts into the end of the year. On the news, the US Dollar was able to flex down to a fresh yearly low but, suddenly, selling pressure stalled and prices began to reverse.
Last week saw a chorus of dovish Fed-speak hit the airwaves, with a continued look towards more and more rate cuts. But, again, USD bears continued to stall at prints or tests of fresh lows.
This isn’t to say that there lacks motive or reason for Dollar-bears to make a push. USD/JPY, for example, could have more carry trade left to unwind. And for the first two months of Q3 this was a dominating factor in currency markets. We saw a shocking response on Friday on the back of Japanese elections, even with the incoming PM saying that he plans to lean on ‘loose monetary policy.’ That move-lower in USD/JPY continued into this week until the 141.69 swing came into the picture to provoke a bounce.
But perhaps more key to the USD’s stall has been what’s shown in EUR/USD over the past month. The pair had a bullish first two months of Q3 until the 1.1200 level came into play in late-August. And as we wind down Q3 that resistance remains in-play today.
EUR/USD Daily Price Chart
Deducing Deduction
At this point EUR/USD bears have pretty much only been able to hold back bullish breakouts. From that August resistance inflection at 1.1200, there was a downward trend that lasted for a few weeks. But, bulls came in to hold support just above the 1.1000 handle (2 pips above, to be exact), and this led to a rally that held through the Fed’s rate cut.
But that rally initially stalled inside of the 1.1200 highs, with 1.1175 holding the line. And then last week, amidst the dovish Fed-speak and a speech from US Treasury Secretary, Janet Yellen, another wave of weakness hit the Greenback and this time, EUR/USD bears were able to push above 1.1200, albeit slightly.
At that point, another level of interest came into play from longer-term charts, with the 61.8% retracement of the ‘lifetime move’ in the pair coming in to hold the highs. Another brisk reaction showed from there but, again, bears couldn’t take advantage of the move to drive down to fresh lows.
EUR/USD Monthly Price Chart
And again, so far this week, that rush of USD-weakness on the back of USD/JPY breaking further down pushed another 1.1200 test in EUR/USD but the pair has continued to show stall.
From the daily chart below we can see where price action is growing tighter and tighter with continued resistance holding around 1.1200 to go along with higher-lows. Bulls have been active on tests of support thus far which is what’s led to this bullish trendline after the 1.1000 bounce. But, to date, they haven’t been able to run with breakouts and this is a big part of that stalling that’s so far shown in DXY.
EUR/USD Daily Price Chart
What Comes After Deduction?
For this to turn into a legitimate turn we’re going to need to see some continued change from bears. They can defend resistance – but can they overmatch bulls on tests of higher-lows to finally take control of near-term price action? That’s been the missing ingredient to a larger turn so far and that’s what I’m watching for this week.
As of this writing, there’s a test at a big spot of 1.1140, which is a prior swing high that’s confluent with the shorter-term trendline taken from the 1.1000 bounce in the pair. Sellers driving below that would be a big first step. After that, there’s the swing-low from Wednesday of last week at 1.1122, and you can see from the lower wicks on the candles that followed that low last week, there was an element of bullish anticipation. Bears are going to need to chew through that, as well.
If they can make it below 1.1100, that would be indication of increasing anticipation, at which point a bounce to a lower-high could be an attractive variable, with focus on any of the aforementioned support levels as possible resistance, and we could even add on 1.1155 and 1.1175 for that.
The major test for sellers in that scenario is the same 1.1000 level that thwarted bears ahead of the ECB’s rate cut a few weeks ago. If sellers can take that out, the longer-term range looked at above will look more attractive for continuation and, in-turn, bounce scenarios in the US dollar will take on greater attraction, as well.
EUR/USD Four-Hour Price Chart
What if the USD Does Break Down?
I’ve talked about this at-length of late because frankly we cannot rule it out. All that we have at this point is deduction that sellers haven’t yet been able to run a break. But – if we do get that scenario, I think there are simply greener pastures elsewhere, in a pair with a currency not being pushed lower by greater rate cut expectations. This keeps the door open for bullish continuation scenarios in GBP/USD or AUD/USD, both of which have been able to set fresh yearly highs while driving topside trends even as the US Dollar has held within the range.
--- written by James Stanley, Senior Strategist
Related tags:
Latest market news




The complete CFD trading experience
Award-winning platforms, competitive spreads, low commissions and dedicated support.
We live and breathe the markets and are dedicated to helping traders realise their ambitions as we continue to set the industry bar.
Economic calendar
Web Trader platform
Our sophisticated web-based platform is packed with features.
Related articles
EUR/USD weekly outlook: FOMC and ECB to set the tone
The current backdrop is modestly bearish. On Friday, the EUR/USD closed modestly lower, down for the third consecutive day. The pair also posted a weekly decline after staging a modest recovery attempt in the previous week. Out of the past 8 weeks, the EUR/USD has fallen on 6 occasions. There is not much supporting factors for the single currency right now. So, the upside remains capped.


US Dollar Price Action Setups: EUR/USD, USD/JPY, GBP/USD, USD/CAD
The Dollar is working on its second consecutive red week and while sellers didn’t exactly pounce on fresh lows, there’s an opening door for bears to make a move.

Silver forecast: metals liquidation drags XAG/USD into $50-55 support
Silver has broken its July low and slipped into a long-term support zone as the selling in precious metals deepens. The chart shows where the metal could bottom, and next week's Fed decision may decide whether it does.
StoneX Europe Ltd may make third party material available on this website which may contain information included but not limited to the conditions of financial markets. The material is for information purposes only and does not contain, and should not be construed as containing, investment advice and/or investment recommendation and/or an investment research and/or an offer of or solicitation for any transactions in financial instruments; any decision to enter into a specific transaction shall be made by the client following an assessment by him/her of their situation.
StoneX Europe Ltd makes no representation or warranty and assumes no liability as to the accuracy or completeness of the information provided, nor any loss arising from any investment based on a recommendation, forecast or other information supplied. You should always seek independent advice as to your suitability to speculate in any related markets and your ability to assume the associated risks, if you are at all unsure. We are not under any obligation to update any such material. Any opinion made may be personal to the author and may not reflect the opinion of StoneX Europe Ltd.