




European Open All Eyes on Risk Sentiment UK Data Up Next
Whilst currency markets paused for breath overnight, much of the Asian share market was trading lower ahead of today’s open.
Share this:

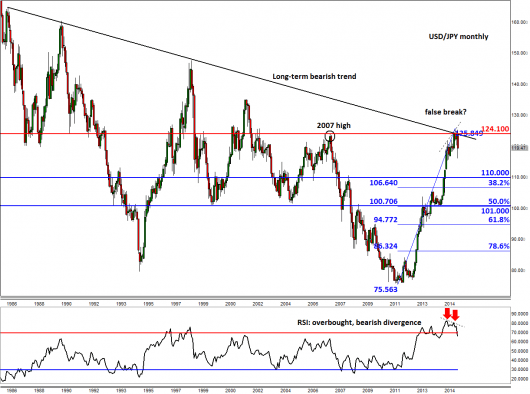
The USD/JPY’s strong correlation with the equity markets, if sustained, point to significantly lower levels for the major indices, especially the Nikkei. That’s because the USD/JPY’s monthly chart (in figure 1) suggests a major top may have been formed around the 124/26 area. Although the markets may swing wildly going forward, it will essentially be in a downward trending environment – at least judging by the behaviour of the USD/JPY currency pair and until proven wrong.
The first thing to note on the monthly chart of the USD/JPY is that a trend line that stretches back all the way to the year 1986 cuts through this region. On top of this, there is an apparent false breakout reversal pattern above the 2007 high of 124.10. Making the bearish case even more strong is the falling momentum: the RSI has created a clear bearish divergence with price above the overbought territory of 70 i.e. it has created a lower high when price made its most recent higher high. For all these reasons alone, the path of least resistance is now clearly to the downside. Worryingly for the bulls, the next major long-term support is not seen until the psychologically-important level of 110 – nearly 1000 pips away from here.
Zooming in to a daily chart in figure 2, we can see some more bearish technical signals. The bearish engulfing candle that was created on August 12 – exactly two weeks ago today – between 123.75 and 125.25 correctly suggested that there was a shift from buying to selling pressure. Price created a double top reversal formation there, leading to an eventual breakdown of several key supports. As more and more supports broke down, the downward momentum gathered pace. The turning point was the break of the bullish trend line at just below the 122 handle. When this was taken out on Monday, speculators went into panic mode and sold the USD/JPY en masse. The sharp rebound from Monday’s low may have offered the bullish speculators a chance to at least reduce their positions at better levels. Given these technical developments we may see more and more speculators turning bearish now, especially if the US Federal Reserve refuses to raise interest rates this year.
As the technicals clearly signal that the path of least resistance is to the downside, speculators will need to be wary of further sharp falls in the days and weeks to come, even if the momentum indicators suggest prices may be oversold in the short term. For as long as the bears defend the broken neckline of the double top pattern around 120.45, the near-term trend would remain bearish. Even if the USD/JPY manages to push above this level, the slightly longer term bearish outlook wouldn’t change materially as broken supports such as 122 or 123 may turn into resistance at some future moment.
On the downside, a closing break below the 118.50 support level is needed for price to extend its decline towards the double top measured move target of around 115.75. Thereafter, the 261.8% Fibonacci extension level of the most recent upswing comes in at 112.55, followed by some of the much longer term levels that are shown on the monthly chart.
Related tags:
Latest market news




The complete CFD trading experience
Award-winning platforms, competitive spreads, low commissions and dedicated support.
We live and breathe the markets and are dedicated to helping traders realise their ambitions as we continue to set the industry bar.
Economic calendar
Web Trader platform
Our sophisticated web-based platform is packed with features.
Related articles
EUR/USD weekly outlook: Oil, inflation and NFP in focus
After coming under significant pressure in recent weeks, the EUR/USD came off its lows to finish the week on a positive note on Friday, albeit with only a mild rebound. That was not enough to prevent the exchange rate falling for the third consecutive week, as the US dollar and bond yields rallied across the board.


EUR/USD Q4 2026 Outlook: Euro at a Crossroads as Fed, ECB Tighten 9 25 2026
EUR/USD enters Q4 at a pivotal inflection point as competing Fed-ECB policy paths and persistent inflation risks collide with major technical support.


USD/JPY Q4 2026 Outlook: Hawkish Fed Pricing Clashes With Intervention Risk
The year-end tug-of-war is clear: hawkish Fed pricing supports USD/JPY, while intervention risk limits the upside.

StoneX Europe Ltd may make third party material available on this website which may contain information included but not limited to the conditions of financial markets. The material is for information purposes only and does not contain, and should not be construed as containing, investment advice and/or investment recommendation and/or an investment research and/or an offer of or solicitation for any transactions in financial instruments; any decision to enter into a specific transaction shall be made by the client following an assessment by him/her of their situation.
StoneX Europe Ltd makes no representation or warranty and assumes no liability as to the accuracy or completeness of the information provided, nor any loss arising from any investment based on a recommendation, forecast or other information supplied. You should always seek independent advice as to your suitability to speculate in any related markets and your ability to assume the associated risks, if you are at all unsure. We are not under any obligation to update any such material. Any opinion made may be personal to the author and may not reflect the opinion of StoneX Europe Ltd.