




European Open: EUR/USD eyes break of 1.06, potential bull flag on gold
The dollar is on track to break a 6-week winning streak, and the euro and gold may present a couple of opportunities around that theme.
Share this:

Asian Indices:
- Australia's ASX 200 index rose by 73.9 points (1.05%) and currently trades at 7,138.40
- Japan's Nikkei 225 index has risen by 318.1 points (1.2%) and currently trades at 26,720.94
- Hong Kong's Hang Seng index has risen by 368.95 points (1.83%) and currently trades at 20,489.63
- China's A50 Index has risen by 237.18 points (1.8%) and currently trades at 13,439.25
UK and Europe:
- UK's FTSE 100 futures are currently up 95.5 points (1.31%), the cash market is currently estimated to open at 7,398.24
- Euro STOXX 50 futures are currently up 41 points (1.13%), the cash market is currently estimated to open at 3,681.55
- Germany's DAX futures are currently up 157 points (1.13%), the cash market is currently estimated to open at 14,039.30
US Futures:
- DJI futures are currently up 211 points (0.68%)
- S&P 500 futures are currently up 135.75 points (1.14%)
- Nasdaq 100 futures are currently up 33 points (0.85%)

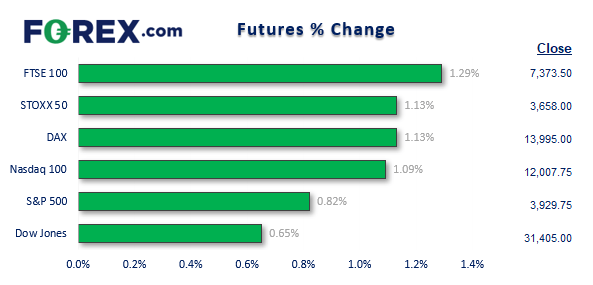
Asian market in the green thanks to PBOC lending rate cut
China cut their 5-year mortgage reference rate for the second time this year, and by mech more than expected, to support the housing sector. The 5-year loan prime rate (LPR) was cut by -15 bps from 4.6% to 4.45%. Earlier this week Chinese Premier Li called for policy adjustments and Xi Jinping’s top economic advisor publicly supported helping the tech sector. Major benchmarks across Asia were all in the green, led by China.
EUR/USD pulls back into support overnight
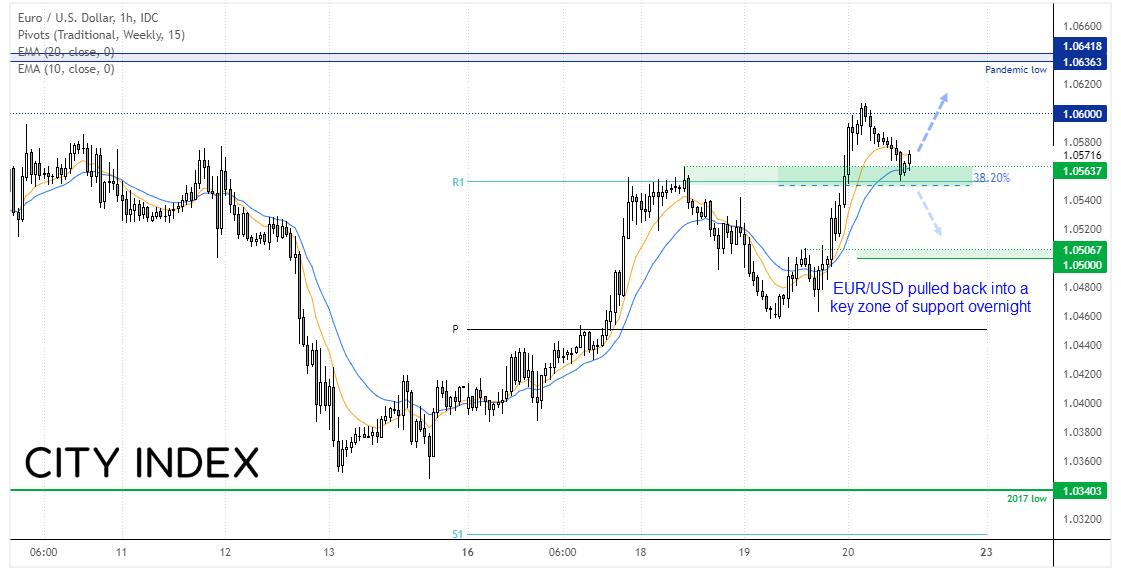

The US dollar retraced against some of yesterday’s losses overnight, which pushed the Australian dollar down to 70c (a key level to monitor this session) and EUR/USD down to a key zone of support. But it likely won’t be enough to help the US dollar escape breaking a 6-week running streak by the close of today.
We can see on the hourly chart that a strong bullish trend is forming on EUR/USD. Yesterday’s rally petered out around 1.0600 before pulling back to the 38.2% Fibonacci retracement and weekly R2 pivot. The market is now trying to form a base and we suspect it can rally from current levels and have another crack at 1.0600. A break or hourly close beneath 1.0550 invalidates the near-term bullish bias and suggests a deeper correction is underway.
Potential bull flag on gold


I noted yesterday how yields were looking toppy, which itself was based on an observation that the 10-year bond had rallied form a key support level and bears had closed out gross longs. This proved to be beneficial for gold yesterday which closed at a 10-day high. For the rally to advance today, we’d like to see the US dollar and yields continue to weaken.
As for gold, a bullish trend has developed on the hourly chart and probed trend resistance. A potential bull flag is forming above the weekly pivot point and 100-hour eMA, and the pattern projects a target around 1875. Although 1858 and 1865 make likely interim targets.
FTSE: Market Internals

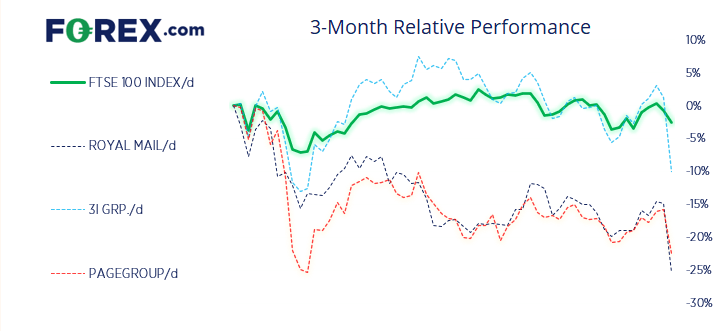
FTSE 350: 4070.24 (-1.82%) 19 May 2022
- 57 (16.29%) stocks advanced and 287 (82.00%) declined
- 3 stocks rose to a new 52-week high, 39 fell to new lows
- 23.14% of stocks closed above their 200-day average
- 98.29% of stocks closed above their 50-day average
- 10.86% of stocks closed above their 20-day average
Outperformers:
- + 10.16% - HomeServe PLC (HSV.L)
- + 5.20% - Darktrace PLC (DARK.L)
- + 4.50% - Ferrexpo PLC (FXPO.L)
Underperformers:
- -12.38% - Royal Mail PLC (RMG.L)
- -11.03% - 3i Group PLC (III.L)
- -7.81% - Pagegroup PLC (PAGE.L)
Up Next (Times in BST)
- BOE’s Chief economist speaks at 08:30.
- ECB member Lane speaks at 11:00.
How to trade with City Index
You can easily trade with City Index by using these four easy steps:
- Open an account, or log in if you’re already a customer
• Open an account in the UK
• Open an account in Australia
• Open an account in Singapore
- Search for the company you want to trade in our award-winning platform
- Choose your position and size, and your stop and limit levels
- Place the trade
How to trade with FOREX.com
Follow these easy steps to start trading with FOREX.com today:
- Open a Forex.com account, or log in if you’re already a customer.
- Search for the pair you want to trade in our award-winning platform.
- Choose your position and size, and your stop and limit levels.
- Place the trade.
Related tags:


The complete CFD trading experience
Award-winning platforms, competitive spreads, low commissions and dedicated support.
We live and breathe the markets and are dedicated to helping traders realise their ambitions as we continue to set the industry bar.
Economic calendar
Web Trader platform
Our sophisticated web-based platform is packed with features.
Related articles

USD/JPY weekly outlook: Quarter turn scrambles rates regime
USD/JPY’s tight relationship with front-end US rates broke down sharply last week, but quarter-turn flows and positioning suggest the disconnect may prove temporary.


USD/CAD forecast: rally could accelerate above June highs at 1.4250
USD/CAD recovered quickly after weaker US jobs data, keeping the bullish trend in focus. A move above the June highs could accelerate the rally as inflation keeps the Fed under pressure.


USD Sets Fresh Yearly High as EUR/USD Drops Dramatically, USD/JPY Stable
Well, it was a week of USD strength that wasn’t entirely pushed by USD/JPY, as a strong sell-off in EUR/USD has pushed the major pair to its most oversold state in a decade.
StoneX Europe Ltd may make third party material available on this website which may contain information included but not limited to the conditions of financial markets. The material is for information purposes only and does not contain, and should not be construed as containing, investment advice and/or investment recommendation and/or an investment research and/or an offer of or solicitation for any transactions in financial instruments; any decision to enter into a specific transaction shall be made by the client following an assessment by him/her of their situation.
StoneX Europe Ltd makes no representation or warranty and assumes no liability as to the accuracy or completeness of the information provided, nor any loss arising from any investment based on a recommendation, forecast or other information supplied. You should always seek independent advice as to your suitability to speculate in any related markets and your ability to assume the associated risks, if you are at all unsure. We are not under any obligation to update any such material. Any opinion made may be personal to the author and may not reflect the opinion of StoneX Europe Ltd.