



EURUSD, Nasdaq Forecast: Is Trump Signaling Another Bull Run?
Markets turn neutral after Trump’s Davos speech lifts risk assets. Nasdaq tests resistance, EURUSD capped below 1.17 as primary trends stay in focus.
Share this:

Key Events
• Flash manufacturing and services PMI on Friday are expected to add volatility risks to EURUSD’s capped gains as diplomatic tensions between the US and the EU fade.
• The removal of February 1 tariff threats lifted markets back toward key resistance levels. While gold remains elevated and eyeing the 5,000 threshold, caution remains warranted before any broader momentum recharge and the resumption of primary bull runs.
CNN Fear and Greed Index
Source: CNN
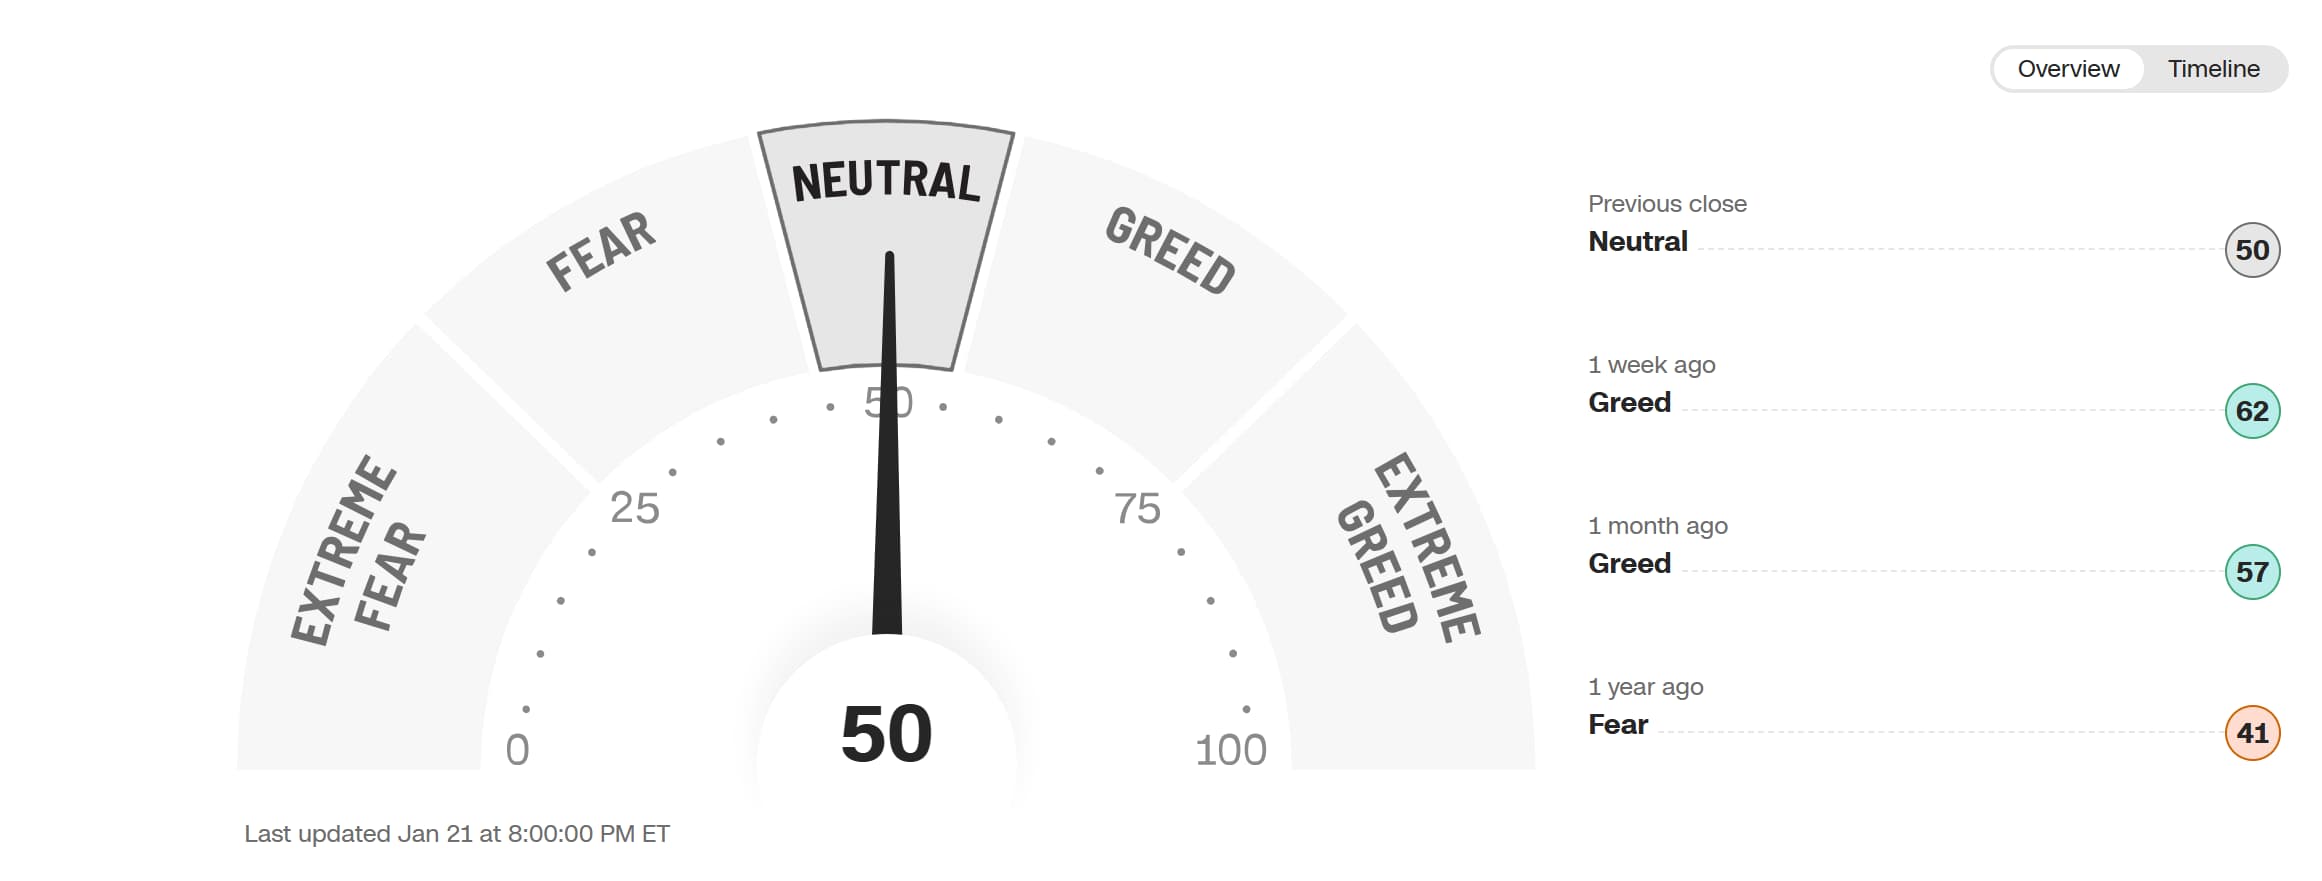
Sentiment has returned to neutral after leaning bearish, following Trump’s positive remarks on the US economy. He highlighted the impact of tax reductions, tariff income, rising 401k retirement valuations driven by the stock market surge, and overall US economic growth at +4.3%, according to the latest GDP figures. These comments helped restore investor confidence and bullish speculation, lifting key risk assets and US indices from fragile support levels.
• Bitcoin rebounded from 87,000 toward the 90,000 zone
• Nasdaq recovered from 24,900 back to 25,500
• Dow Jones climbed from 48,300 toward 49,200
Trump’s earlier recommendation to “buy the economy” had previously helped markets rebound from steep lows following tariff concerns in April 2025. However, his more recent outlook suggesting further bullish expectations for the market this year continues to be met with caution. This skepticism reflects the consolidations seen across US indices throughout December and January at elevated highs rather than depressed levels. The current price behavior echoes early 2025 conditions, alongside signs of stretched momentum and the persistent hold of gold and silver near record levels.
The EU–US tariff elimination headline briefly pulled gold prices lower by nearly 100 points before a swift rebound back above the 4,800 area, while Nasdaq was lifted toward the 25,500 resistance level. This zone remains pivotal, as it may either confirm a shift back toward a bullish bias or reinforce the continuation of a broader consolidation phase.
In line with the recovery in US indices, the US dollar regained strength, capping EURUSD gains below the 1.17 mark. This once again underscores the dominance of longer-term trends over short-term, headline-driven volatility, or market noise.
To clarify the key trends currently in focus and driving price action amid shifting headlines:
EURUSD Outlook: 2 Week Time Frame – Log Scale
Source: Trading view
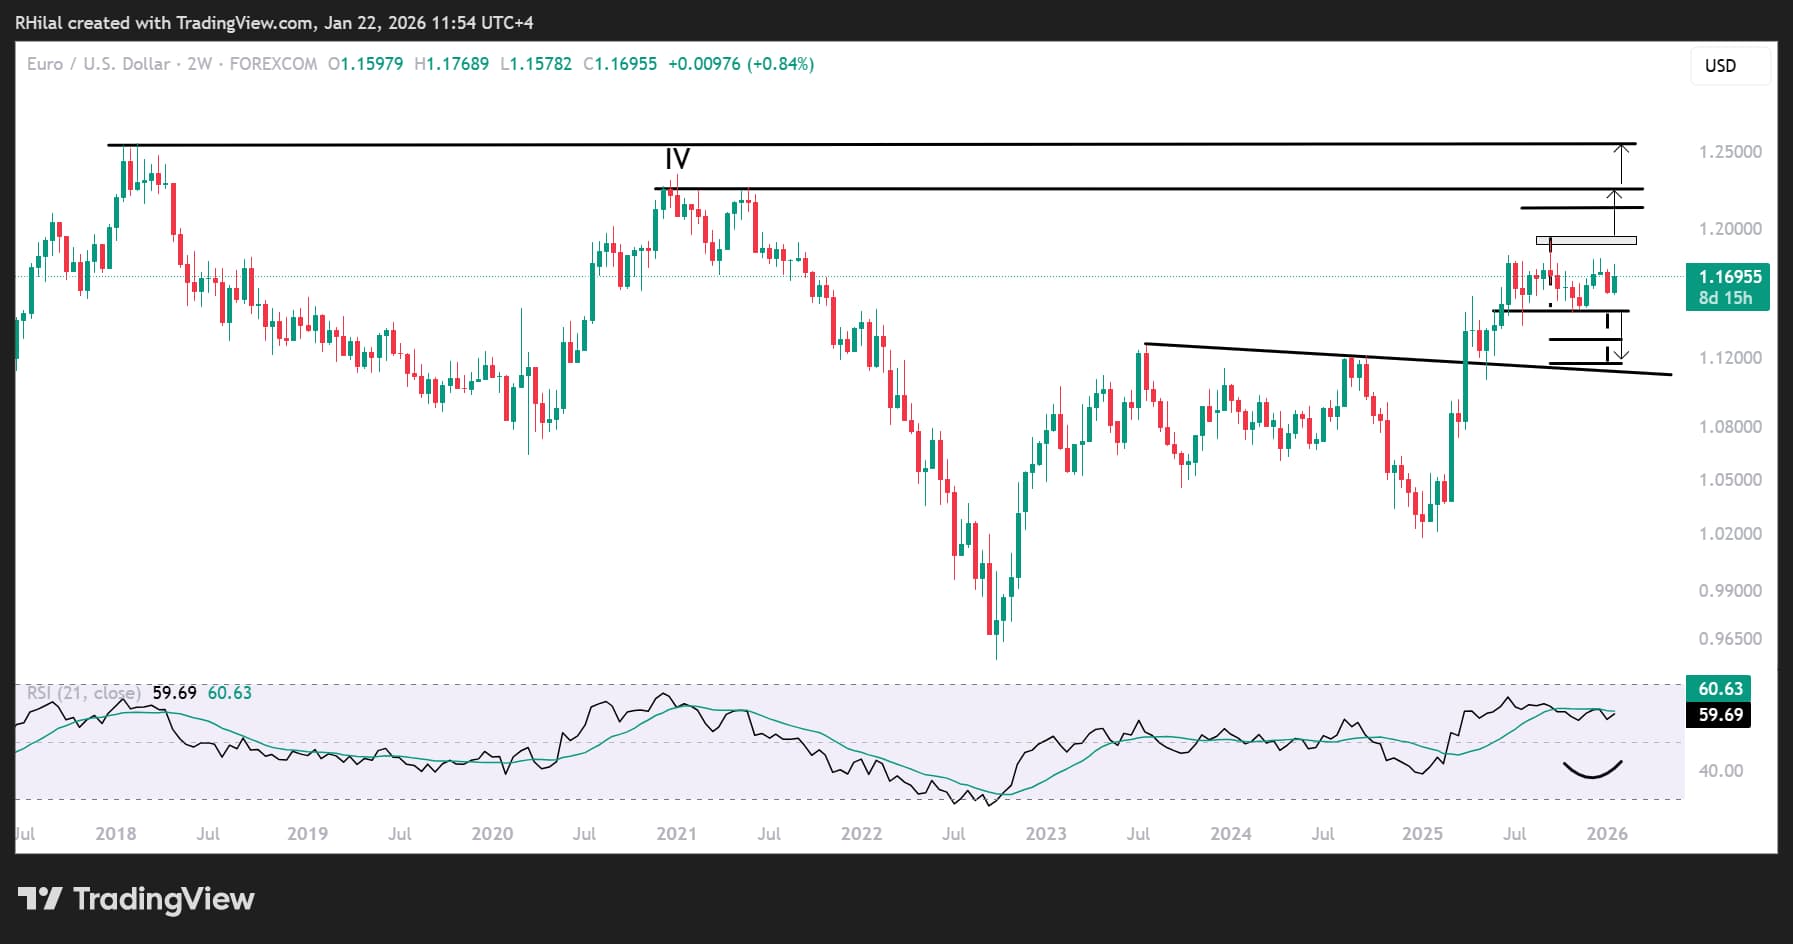
Despite headline-driven turbulence, EURUSD continues to trade within a defined range between 1.15 and 1.17, extending from June 2025. Recent developments have reinforced this consolidation from both the upper and lower bounds. The broader structure remains fragile and could evolve into either a head-and-shoulders reversal pattern or a bullish continuation flag.
The scenarios are as follows:
A sustained hold below the 1.1480 level may confirm a head-and-shoulders reversal, dragging price action toward the trendline connecting lower highs between July 2023 and September 2024, near 1.13 and 1.12, offering potential dip-buying opportunities.
A sustained hold above 1.18 would confirm a bullish continuation path, bringing key resistance levels and historical highs from 2021, 2020, and 2018 into focus at 1.22 and 1.25.
Nasdaq Outlook: Daily Time Frame – Log Scale
Source: Trading view
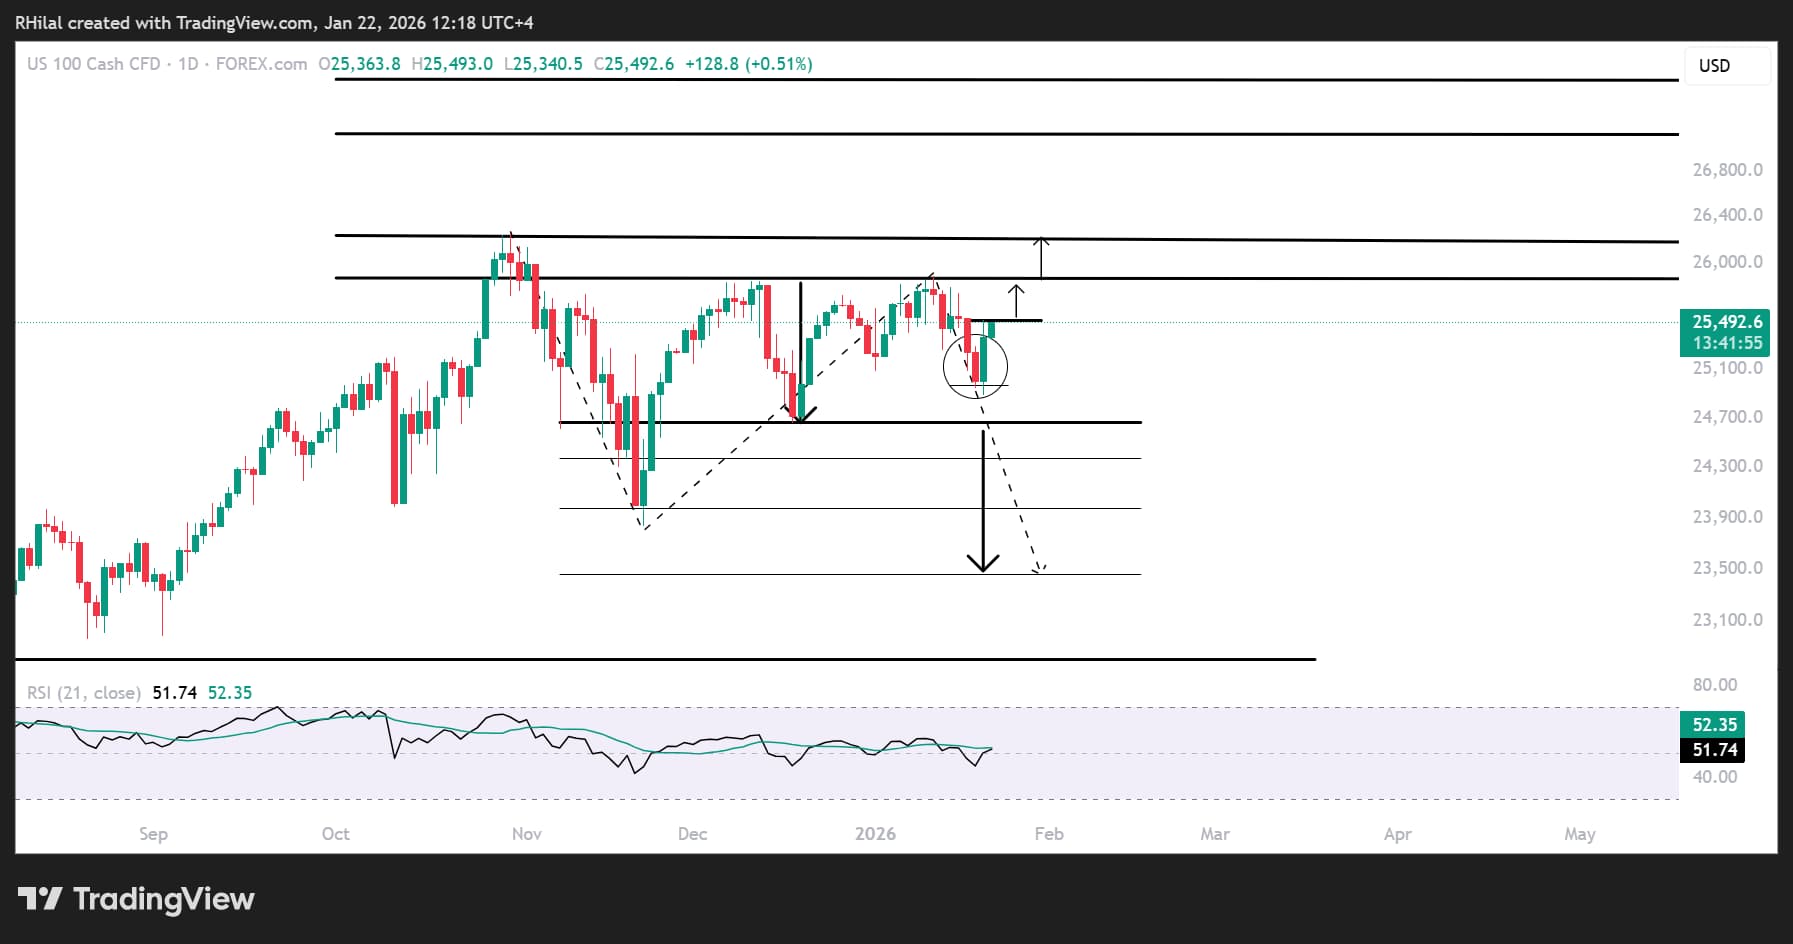
From a daily time-frame perspective, Nasdaq managed to recover from the fragile 24,900 support, posting a bullish engulfing pattern and reclaiming the 25,500 resistance highlighted in yesterday’s article Bitcoin, Nasdaq Outlook: Risk Sentiment Holds Neutral Ahead of Trump Speech. This level remains pivotal and could open the path toward 25,800 and 26,300, reinforcing bullish bias and redirecting gains toward the 27,000 threshold.
On the downside, should losses resume and prices close back below the 25,200 and 24,900 support zones, a steeper corrective structure would be confirmed. A break below these levels exposes 24,600, followed by deeper downside risk toward 24,300, 23,900, and 23,400, where dip-buying interest could re-emerge in line with the broader uptrend. The 23,400 level aligns with the projected target of a potential double-top formation and the 100% extension measured from the 26,300 high, the 23,900 November low, and the 25,800 January 2026 high. In more extreme scenarios, the 1.272 extension comes into focus near 22,900.
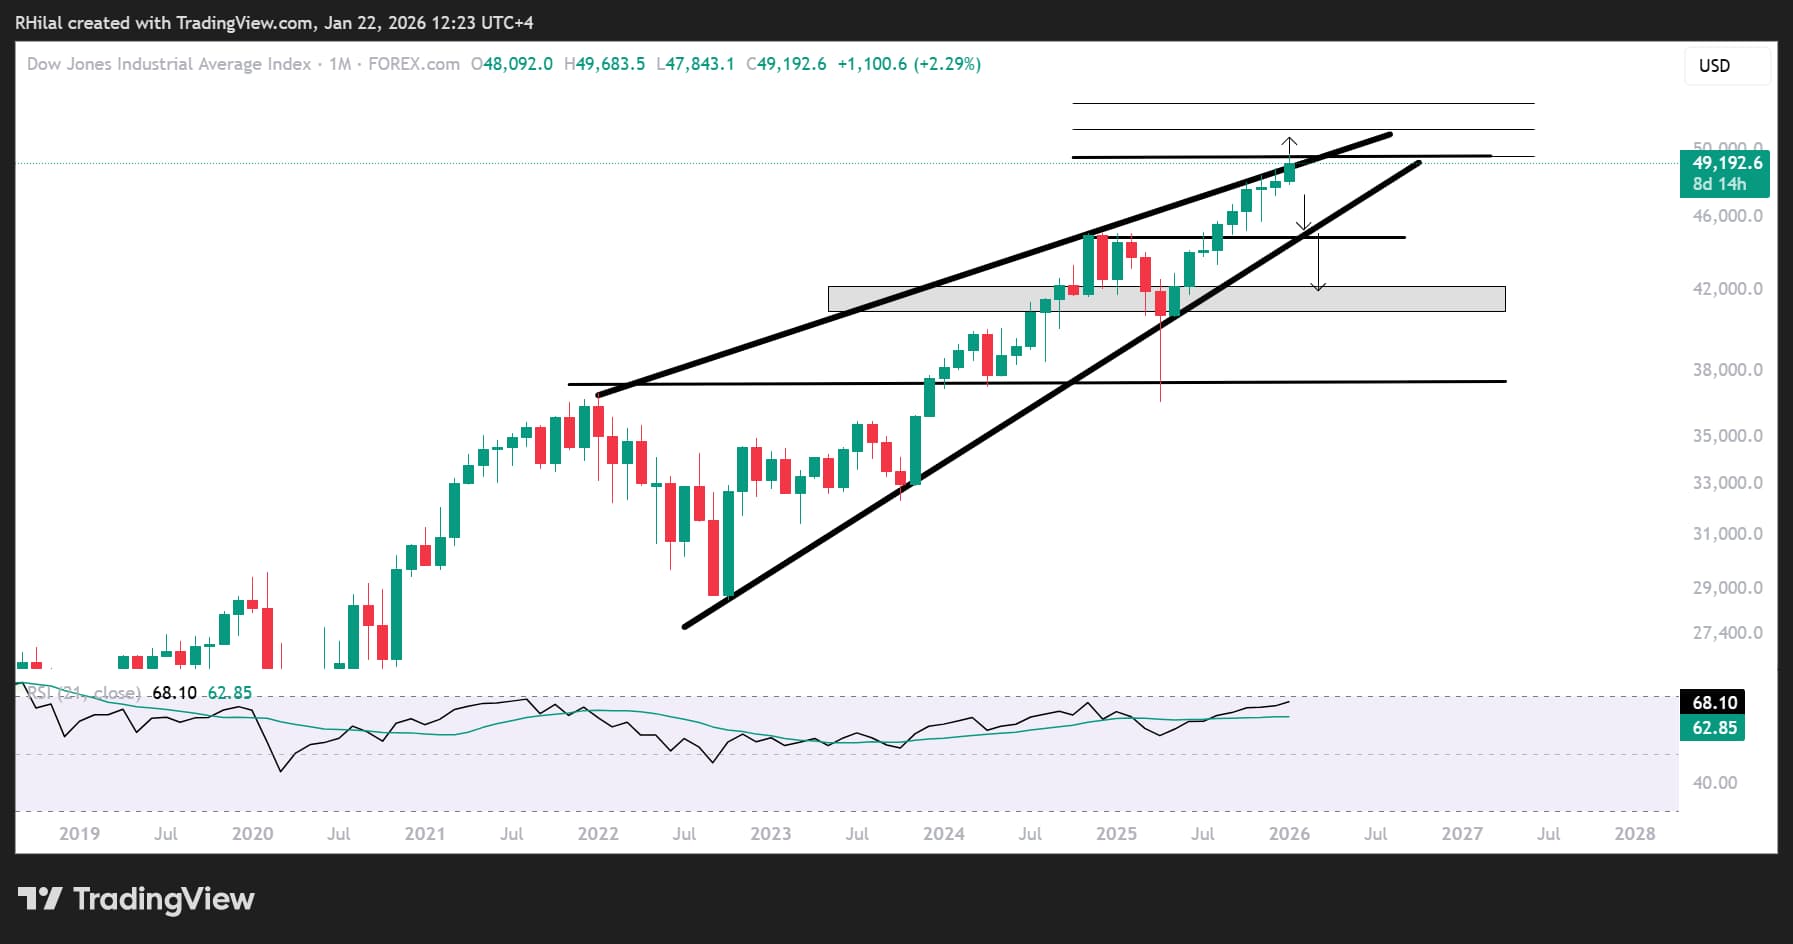
Bearish risks remain correlated with the Dow Jones monthly chart, where an extended consolidation since the 2020 rebound continues to raise the risk of a broader corrective structure before longer-term uptrends resume.
Dow Jones Monthly Outlook – Log Scale
Source: Trading view
Written by Razan Hilal, CMT
Follow on X: @Rh_waves
Related tags:


The complete CFD trading experience
Award-winning platforms, competitive spreads, low commissions and dedicated support.
We live and breathe the markets and are dedicated to helping traders realise their ambitions as we continue to set the industry bar.
Economic calendar
Web Trader platform
Our sophisticated web-based platform is packed with features.
Related articles

AUD/USD hammered by US yields and fading RBA hike bets
US yields, dollar strength and fading RBA hike bets have combined to drive AUD/USD to fresh multi-month lows. The macro and technical bias remains bearish, although history suggests parts of the move are now reaching unusually stretched levels.

EUR/USD Forecast: Euro Struggles to Find Support Even After U.S. PCE Data
The euro continues to face a challenging environment in the short term. The currency has struggled to regain ground against a U.S. dollar that remains firmly supported, a dynamic reflected in EUR/USD, which has now recorded three consecutive losing sessions and a decline of roughly 0.6%.


Canadian Dollar Forecast: USD/CAD Four-Week Rally Eyes Yearly Highs 9 30 2026
USD/CAD has advanced in 14 of the past 15 sessions, but stretched momentum raises the stakes as major resistance and NFP come into focus.

StoneX Europe Ltd may make third party material available on this website which may contain information included but not limited to the conditions of financial markets. The material is for information purposes only and does not contain, and should not be construed as containing, investment advice and/or investment recommendation and/or an investment research and/or an offer of or solicitation for any transactions in financial instruments; any decision to enter into a specific transaction shall be made by the client following an assessment by him/her of their situation.
StoneX Europe Ltd makes no representation or warranty and assumes no liability as to the accuracy or completeness of the information provided, nor any loss arising from any investment based on a recommendation, forecast or other information supplied. You should always seek independent advice as to your suitability to speculate in any related markets and your ability to assume the associated risks, if you are at all unsure. We are not under any obligation to update any such material. Any opinion made may be personal to the author and may not reflect the opinion of StoneX Europe Ltd.