



EURUSD, Nasdaq Outlook: Risk Sentiment Mixed
As gold surges to record highs near $3,800, market risk sentiment does not appear overly fearful, given the stability of the DXY, EURUSD’s rebound toward 1.18, and the Nasdaq’s advance to new records above 24,700.
Share this:

Key Events
- Eurozone flash manufacturing and services PMIs delivered mixed results.
- DXY is holding above 97, while EURUSD is flirting with 1.18 again.
- Nasdaq continues to set new records above 24,700 despite gold’s record-breaking rally.
Growth stocks are leading as markets transition out of the summer lull and into the fall season, where liquidity typically improves. Demand for both growth stocks and safe havens appears to be rising in tandem.
- Nasdaq is trading above 24,700.
- Dow is trading above 46,400.
- Nvidia and Apple are flirting with record highs at 184 and 256, respectively.
- Gold is trading above 3,780.
- EURUSD edged slightly higher at 1.18.
Normally, such elevated gold prices would suggest dampened risk sentiment. However, the parallel strength in technology and AI stocks—now increasingly perceived as new safe havens due to their central role in driving economic growth—may be creating a shift in the traditional haven dynamic. Still, the shadow of geopolitical tensions in Russia and Ukraine, ongoing unrest in the Middle East, and trade uncertainties with the U.S. warrant cautious optimism.
Technical Analysis: Quantifying Uncertainties
EURUSD Outlook: Daily Time Frame – Log Scale
Source: Tradingview
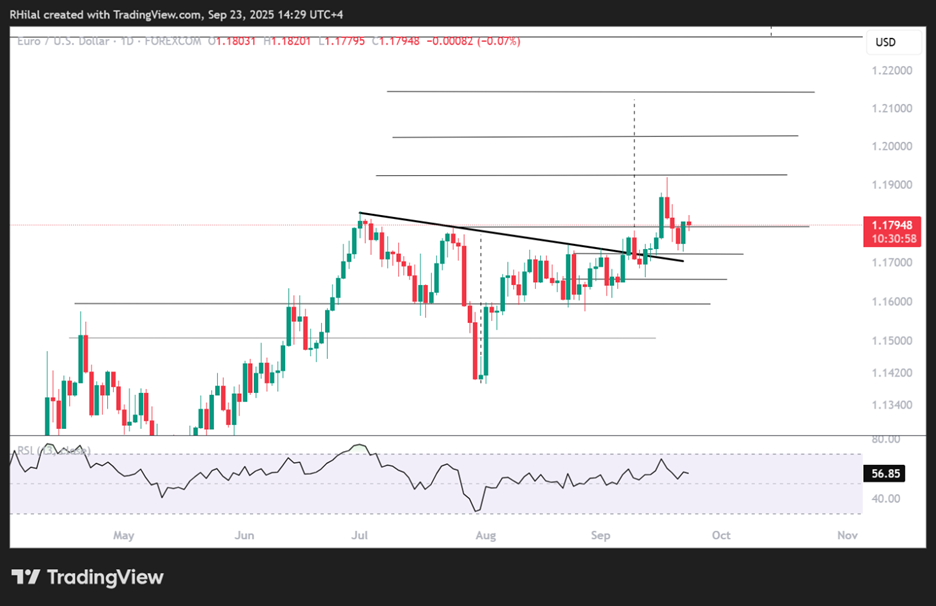
Although EURUSD has slipped back below 1.18, it staged a strong rebound from the 1.1720 support level, marked by a bullish engulfing pattern and a daily RSI bounce from the neutral 50 line after reaching overbought extremes.
- A clean break and hold above 1.1830 is expected to extend gains toward 1.1920, with further upside aligning with the 2021 highs at 1.2020 and 1.2140.
- On the downside, a drop back below 1.1720 and 1.1650 would likely revive bearish momentum, opening the path to 1.1590 and 1.1500, respectively.
Nasdaq Outlook: Daily Time Frame – Log Scale
Source: Tradingview
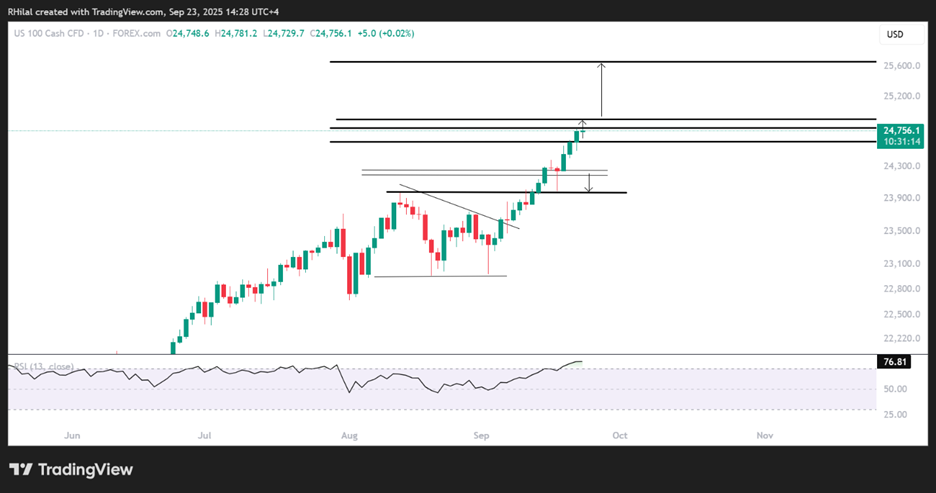
Looking at the Nasdaq chart from a daily time frame perspective, we can see that price action is trading above the 24,700-resistance zone. A hold above this zone may open the path toward 24,900–25,000, and potentially 25,700, in line with continued positive demand for technology and AI-related investments.
On the downside, should a pullback occur below 24,200, a rebound opportunity may be present around 23,900. If not, deeper stress may extend toward the 23,700 level, which could offer another potential buy-the-dip opportunity unless proven otherwise:
Written by Razan Hilal, CMT
Follow on X: @Rh_waves
Related tags:

The complete CFD trading experience
Award-winning platforms, competitive spreads, low commissions and dedicated support.
We live and breathe the markets and are dedicated to helping traders realise their ambitions as we continue to set the industry bar.
Economic calendar
Web Trader platform
Our sophisticated web-based platform is packed with features.
Related articles

USD/JPY weekly outlook: Quarter turn scrambles rates regime
USD/JPY’s tight relationship with front-end US rates broke down sharply last week, but quarter-turn flows and positioning suggest the disconnect may prove temporary.


USD/CAD forecast: rally could accelerate above June highs at 1.4250
USD/CAD recovered quickly after weaker US jobs data, keeping the bullish trend in focus. A move above the June highs could accelerate the rally as inflation keeps the Fed under pressure.


USD Sets Fresh Yearly High as EUR/USD Drops Dramatically, USD/JPY Stable
Well, it was a week of USD strength that wasn’t entirely pushed by USD/JPY, as a strong sell-off in EUR/USD has pushed the major pair to its most oversold state in a decade.

StoneX Europe Ltd may make third party material available on this website which may contain information included but not limited to the conditions of financial markets. The material is for information purposes only and does not contain, and should not be construed as containing, investment advice and/or investment recommendation and/or an investment research and/or an offer of or solicitation for any transactions in financial instruments; any decision to enter into a specific transaction shall be made by the client following an assessment by him/her of their situation.
StoneX Europe Ltd makes no representation or warranty and assumes no liability as to the accuracy or completeness of the information provided, nor any loss arising from any investment based on a recommendation, forecast or other information supplied. You should always seek independent advice as to your suitability to speculate in any related markets and your ability to assume the associated risks, if you are at all unsure. We are not under any obligation to update any such material. Any opinion made may be personal to the author and may not reflect the opinion of StoneX Europe Ltd.