



GBP/USD, Oil Forecast: Two trades to watch
GBP/USD holds steady around 1.3440 ahead of US CPI data. Oil tumbles further on Iran de-escalation hopes.
Share this:


GBP/USD holds steady around 1.3440 ahead of US CPI data
GBP/USD is holding steady around 1.3440 on Tuesday in a cautious mood ahead of U.S. inflation data later today.
Expectations are for U.S. CPI to rise to 3.9% year-on-year, up from 3.7% in September. However, with oil prices rising 15% across October, the risk leans towards an upside surprise.
Core inflation is also expected to rise to 2.8% from 2.6%.
The data comes after Friday's stronger-than-expected nonfarm payroll report helped lift rate-hike expectations. The market is pricing in a 95% probability that the Fed will hike rates next month.
Unexpectedly high inflation could cement those expectations, lifting the U.S. dollar.
Meanwhile, the pound benefited last week from the hawkish Bank of England rate decision, where the central bank hiked rates by 25 basis points in a 9–0 vote, more hawkish than the 7–2 split expected. The MPC also forecast that inflation will rise to 4.9% by mid-2027.
The UK central bank warned that another rate hike was likely should the U.S.-Iran conflict continue. However, with oil prices down significantly, December's meeting looks more like a coin flip. Should oil and energy prices continue to fall, the outlook for further tightening becomes less certain.
Meanwhile, Bank of England Chief Economist Hugh Pill warned that nothing is baked in for next year, with no preset path for rates. His comments struck a more dovish tone and marked a shift away from an assumption of continued tightening. His acknowledgement that rates could stay on hold or even fall if growth stalls reinforces the downside risk for the pound, particularly if economic data starts to underperform.
GBP/USD forecast – technical analysis
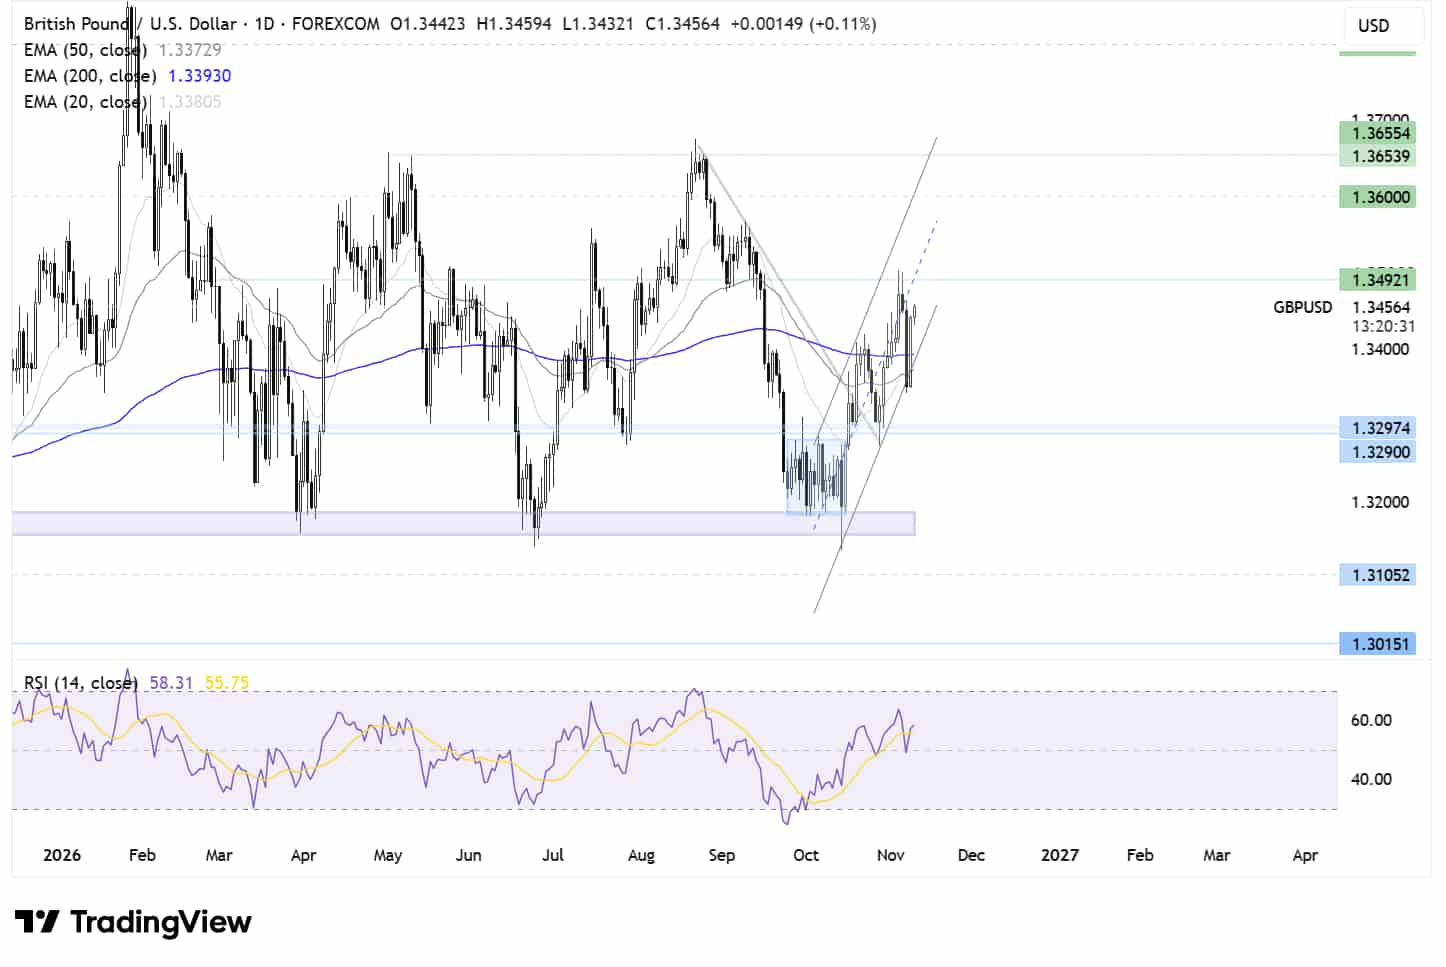
GBP/USD trades within an ascending channel. The price recently recovered from a low of 1.3340, rebounding to 1.3450, where it trades now. The RSI is above 50, keeping buyers hopeful of further upside.
Buyers will need to rise above 1.35 resistance in order to extend the bullish move towards 1.3550, the midpoint of the channel, and the 1.36 round number.
On the downside, immediate support is seen at 1.34, the 200 EMA and the lower band of the rising channel. A break below 1.3350 creates a lower low, turning attention to 1.33. Below this level, attention turns back towards 1.32 and a key support zone across 2026.
Oil tumbles further on Iran de-escalation hopes
Oil prices are falling, extending losses from yesterday, after President Trump lowered expectations for additional military action in Iran.
Brent trades 1.7% lower at $90 a barrel, while WTI is down 1.8% to $85 a barrel. This comes after both benchmarks fell 2% yesterday. Brent is now down 22% from its six-month high reached at the end of October.
President Trump said that he plans to hold off on new military strikes against Iran, giving talks and diplomacy time to make progress.
There appears to have been a slight change of tone from the President following the midterm elections. Meanwhile, the Democrats taking control of Congress could also make further escalation less likely. This helped Brent tumble 16% last week and WTI drop 12%.
Despite the sell-off, prices may struggle to fall significantly lower without more concrete signs of de-escalation and progress in diplomacy. This is particularly the case given that the risk to shipping remains high as Iran continues to attack vessels transiting the Strait of Hormuz.
Oil forecast – technical analysis
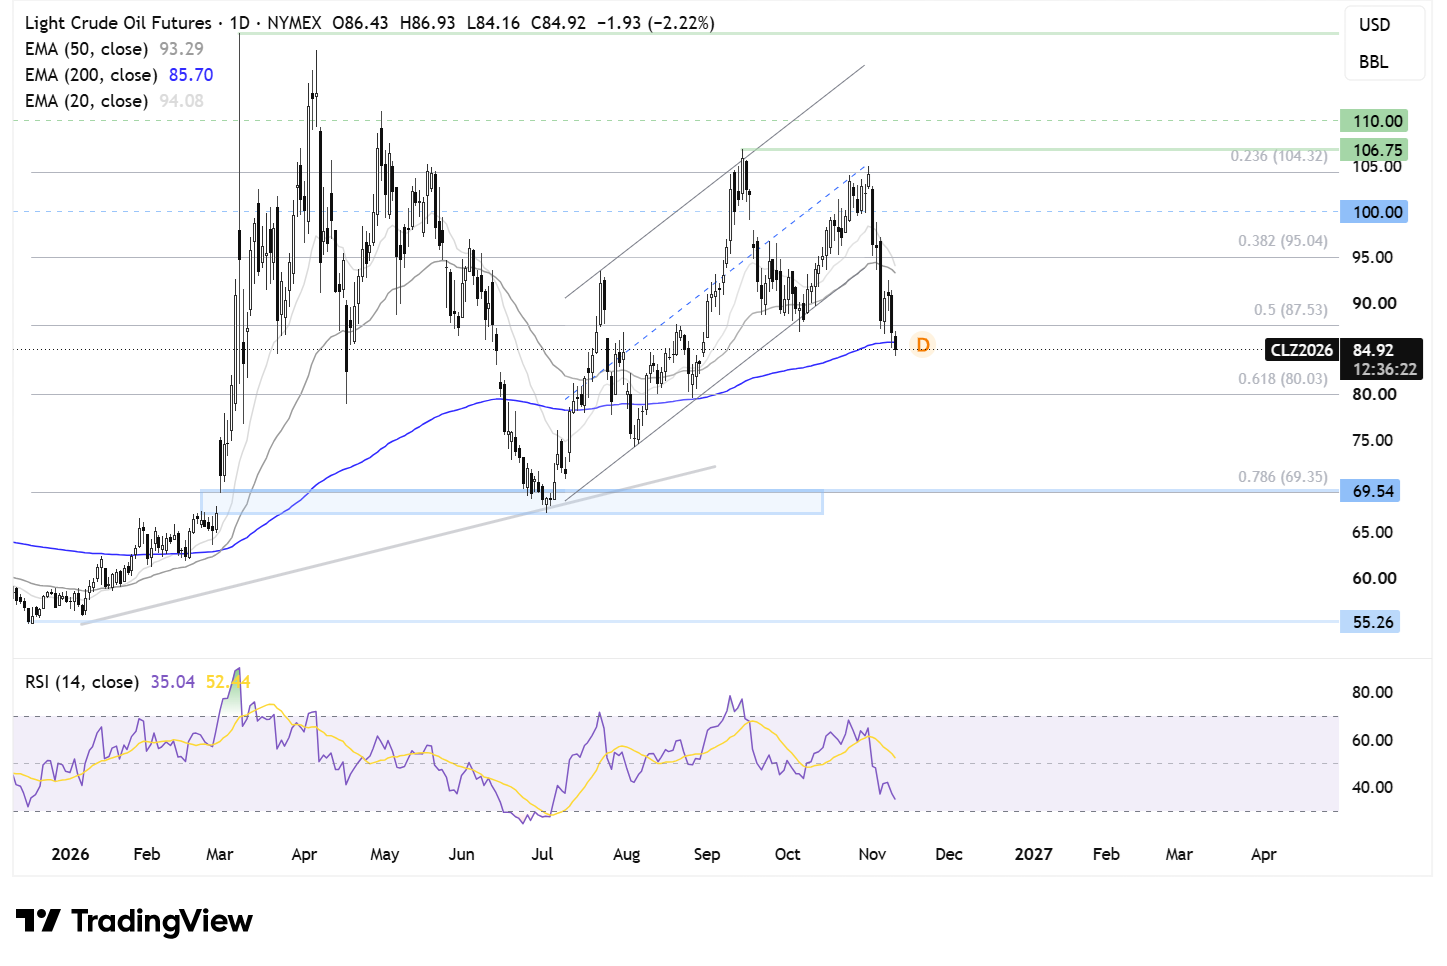
Oil has broken out of its descending channel, falling below the 50 EMA, and is currently attempting to break below the 200 EMA, having fallen to $85.
This, combined with the RSI below 50, keeps sellers hopeful of further downside.
Sellers will look towards $80, the 61.8% Fibonacci retracement of the move from the $55 low to the $120 high. Below here, attention will turn to $75, the August low.
Should the 200 EMA hold as support, buyers need to rise above $88, the 50% Fibonacci retracement. Above here, attention turns to the $95 resistance zone, the 38.2% Fibonacci retracement and the 50 EMA. From here, attention turns to $100.
Related tags:


The complete CFD trading experience
Award-winning platforms, competitive spreads, low commissions and dedicated support.
We live and breathe the markets and are dedicated to helping traders realise their ambitions as we continue to set the industry bar.
Economic calendar
Web Trader platform
Our sophisticated web-based platform is packed with features.
Related articles
DAX Nears New Highs as Investors Rotate Back Into Growth
The DAX continues to push higher, trading above 26,500 as investors extend last week's recovery. Falling oil prices, improving sentiment toward technology stocks and stronger-than-expected German industrial production have helped support risk assets globally. Attention now turns to US inflation data and a busy earnings calendar, which will determine whether the rally can continue toward fresh record highs.

GBP/USD, Oil Forecast: Two trades to watch 101126
GBP/USD holds steady around 1.3440 ahead of US CPI data. Oil tumbles further on Iran de-escalation hopes.

Bond yields and crude call the shots for ASX 200
The ASX 200 has rallied on 93% of occasions this year when Australian three-year bond yields have fallen at least five basis points. With crude prices also plunging, the latest breakout has history on its side.

StoneX Europe Ltd may make third party material available on this website which may contain information included but not limited to the conditions of financial markets. The material is for information purposes only and does not contain, and should not be construed as containing, investment advice and/or investment recommendation and/or an investment research and/or an offer of or solicitation for any transactions in financial instruments; any decision to enter into a specific transaction shall be made by the client following an assessment by him/her of their situation.
StoneX Europe Ltd makes no representation or warranty and assumes no liability as to the accuracy or completeness of the information provided, nor any loss arising from any investment based on a recommendation, forecast or other information supplied. You should always seek independent advice as to your suitability to speculate in any related markets and your ability to assume the associated risks, if you are at all unsure. We are not under any obligation to update any such material. Any opinion made may be personal to the author and may not reflect the opinion of StoneX Europe Ltd.