



Gold Goes for Break – XAU/USD Massive Move Following $4k Support Build
Are we at the point where gold bulls re-take control of the larger trend? It’s been a rough 2026 so far for the metal but for the past month and change buyers have continued to hold the line at support of the $4k level. Now they’re making a move-higher.
Share this:

Gold Talking Points:
- Gold is breaking out today, with spot testing above the $4200 level that was resistance in early July.
- This presents the possibility of trend change after more than a month of support at the $4k level.

I looked into gold at the start of this week and as I said then, sellers were seemingly showing signs of stall as the $4k level had elicited multiple iterations of support. More recently, it was the higher-lows showing a degree of bullish anticipation, but it wasn’t until this morning that buyers took that much needed next step, by pushing price up to a fresh monthly high.
As of this writing, spot gold is testing above the same $4200 level that held the highs back in early July. And the question now is whether they can continue to set the pace following a decisively bearish past six months.
Gold Daily Price Chart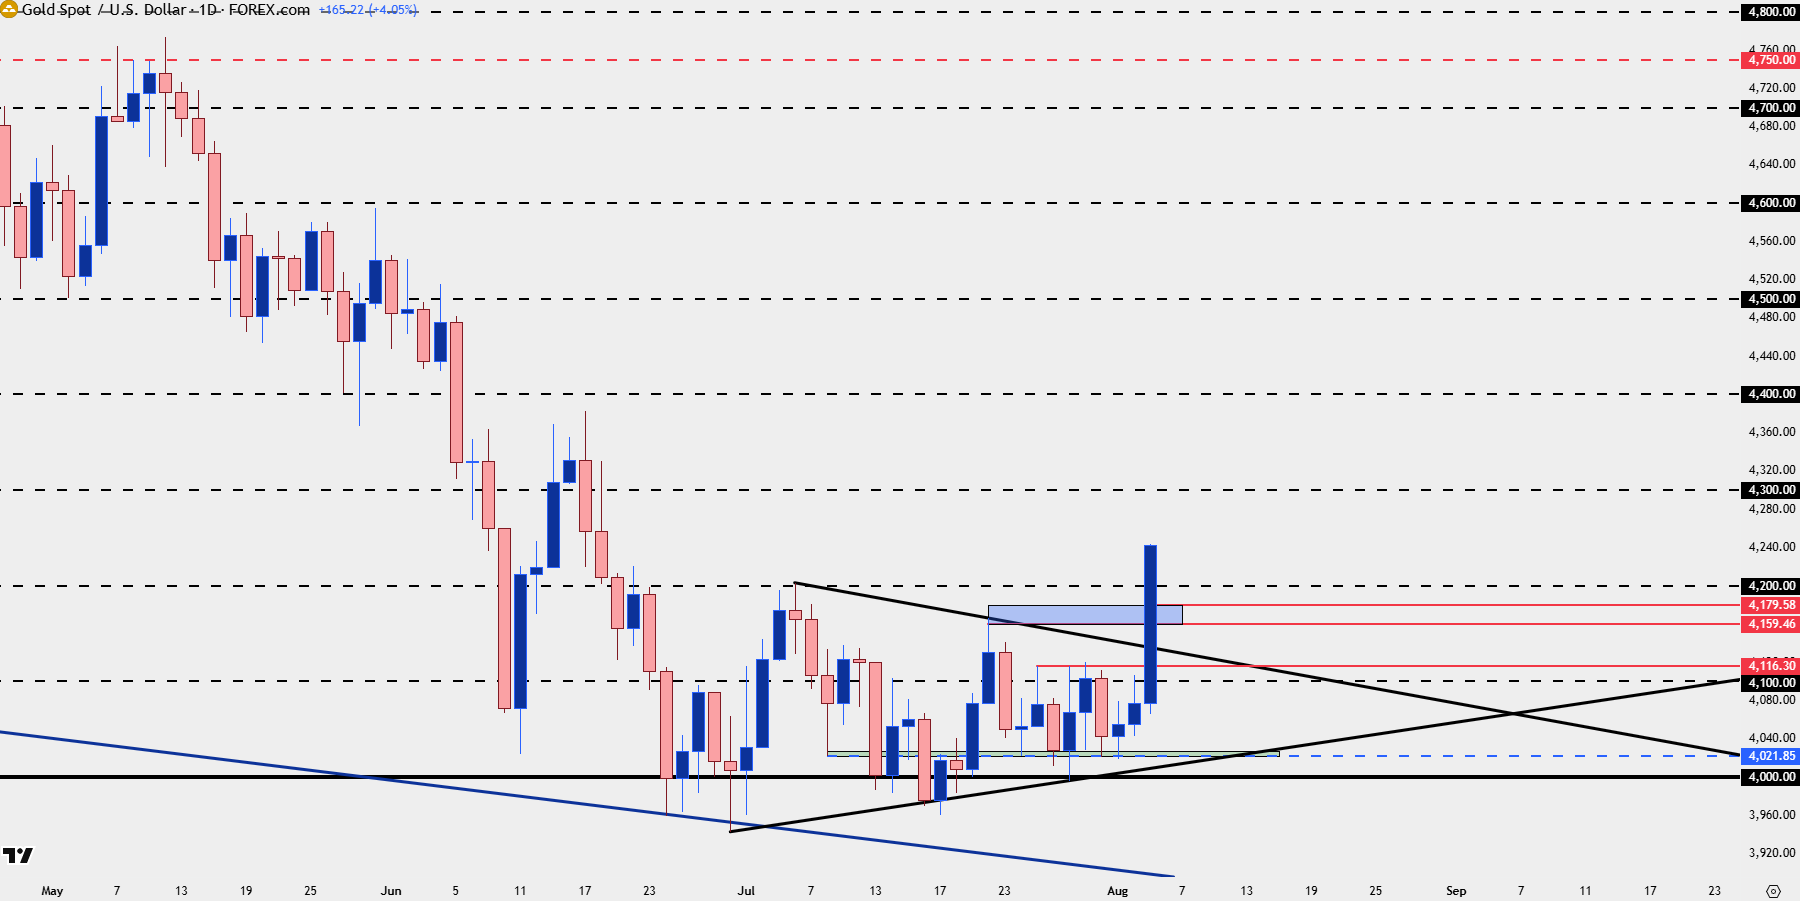
Chart prepared by James Stanley; data derived from Tradingview
Gold Short-Term, Catching the Parabola
The challenge of a breakout often dials back to risk management, as there’s a lack of nearby supports to use for stop placement. So, the trader is often faced with choosing from one of two pathways, and both carry possible downside. Either chase the move or wait for a pullback. While the first option can allow the trader to jump on the prevailing momentum, the downside is the prospect of buying a top (or selling a bottom) and then watching a stop get hit at a sub-standard level, given that dearth of historical price action at those price intervals. The downside of the second approach is that pullback may not show up, and even when it does, there’s no assurance that the trend will continue. But – at the least, with the second pathway, the trader can allow for market dynamics and prior spots of reference to be used for risk management.
The big level now with the breakout taking hold is that $4200 spot. If we see short-term profit taking, then, ideally, buyers would come in to defend this spot of prior resistance. Below that is a key zone, taken from prior swing-highs spanning an approximate $20 range from $4160 up to $4180, and this is key as that was the last spot of higher-low support on the short-term chart before the breakout took hold past $4200.
If that gets taken out, we’d likely be looking at a wide upper wick on the daily or perhaps weekly bar and that would not be such a bullish indication. But – there is a case for support down to around the 4115 area which was a spot of resistance that held the highs twice before the current breakout got started.
Gold Hourly Chart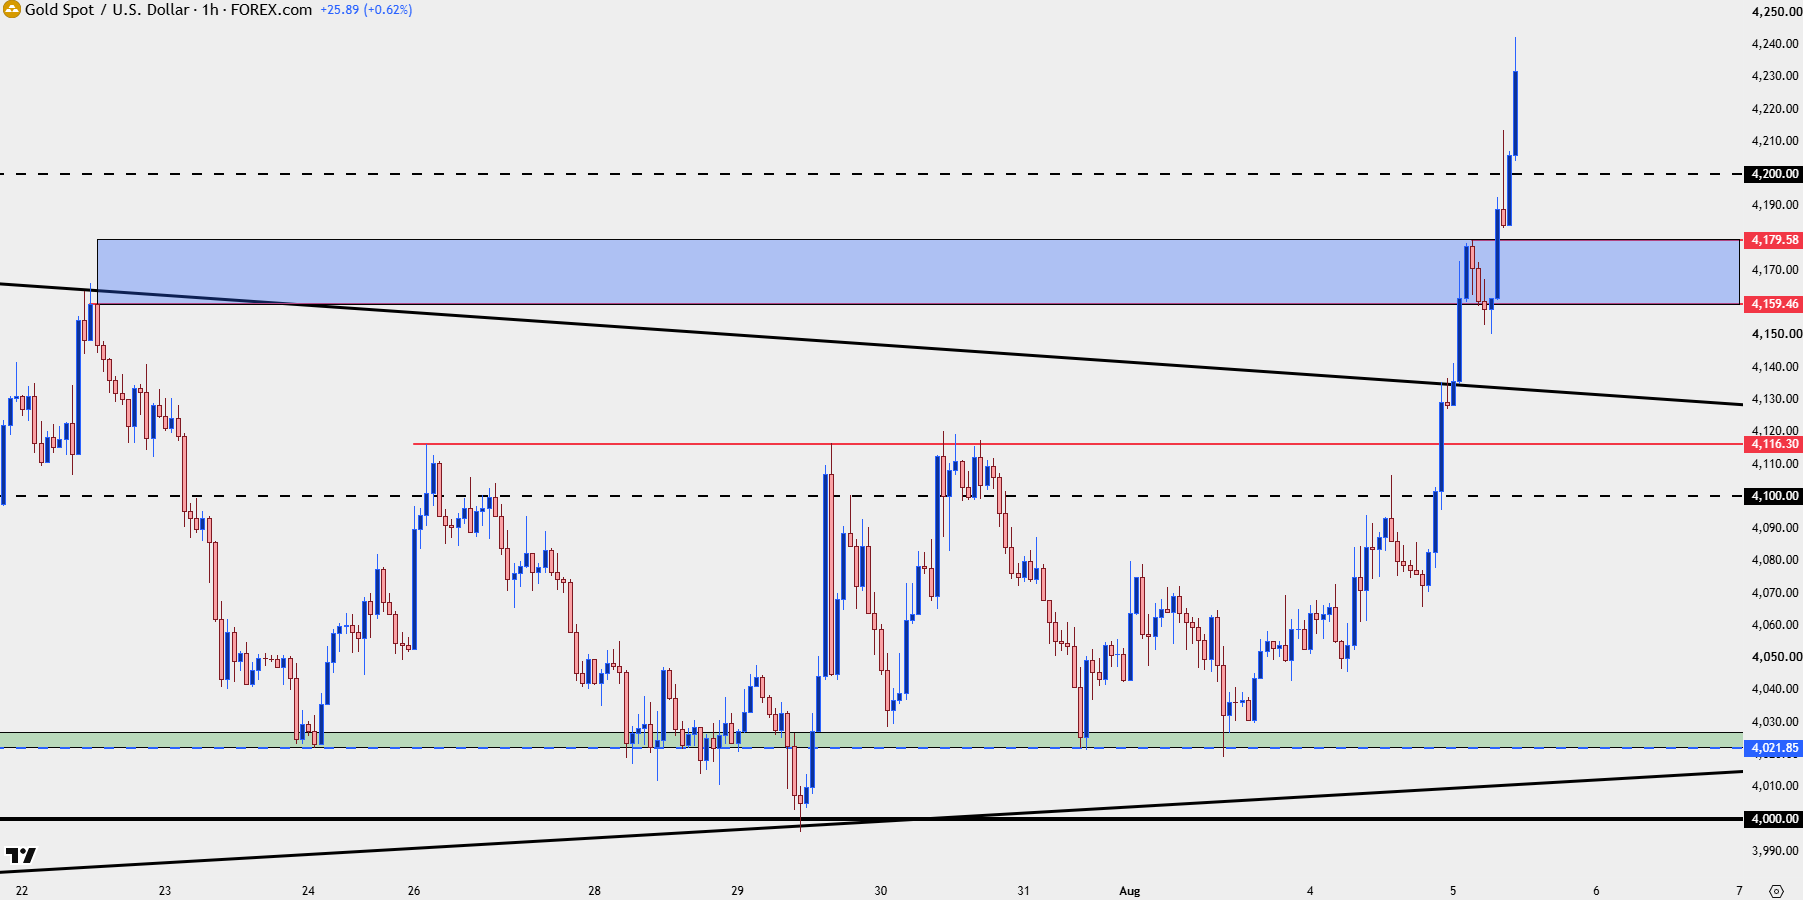
Chart prepared by James Stanley; data derived from Tradingview
Gold Trajectory
If this is truly a tidal shift in gold, there’s a lot of room for bulls to run as the metal had dropped by more than $1600, or 25% in that six-month span of weakness.
This is, perhaps, one reason that traders don’t necessarily need to be so ultra-aggressive on chasing the short-term breakout. Because if this is, truly, the resumption of the broader trend, then there should be ample opportunity for short-term swings to present opportunity. Sitting overhead the next significant level is $4400, which set support back in May before sellers took their shot. And of course above that, $4500 has considerable prior action – to the point that if either of those levels came into play quickly, then some profit taking from short-term buyers should be expected, which could allow for pullbacks and then higher-lows.
Gold Daily Chart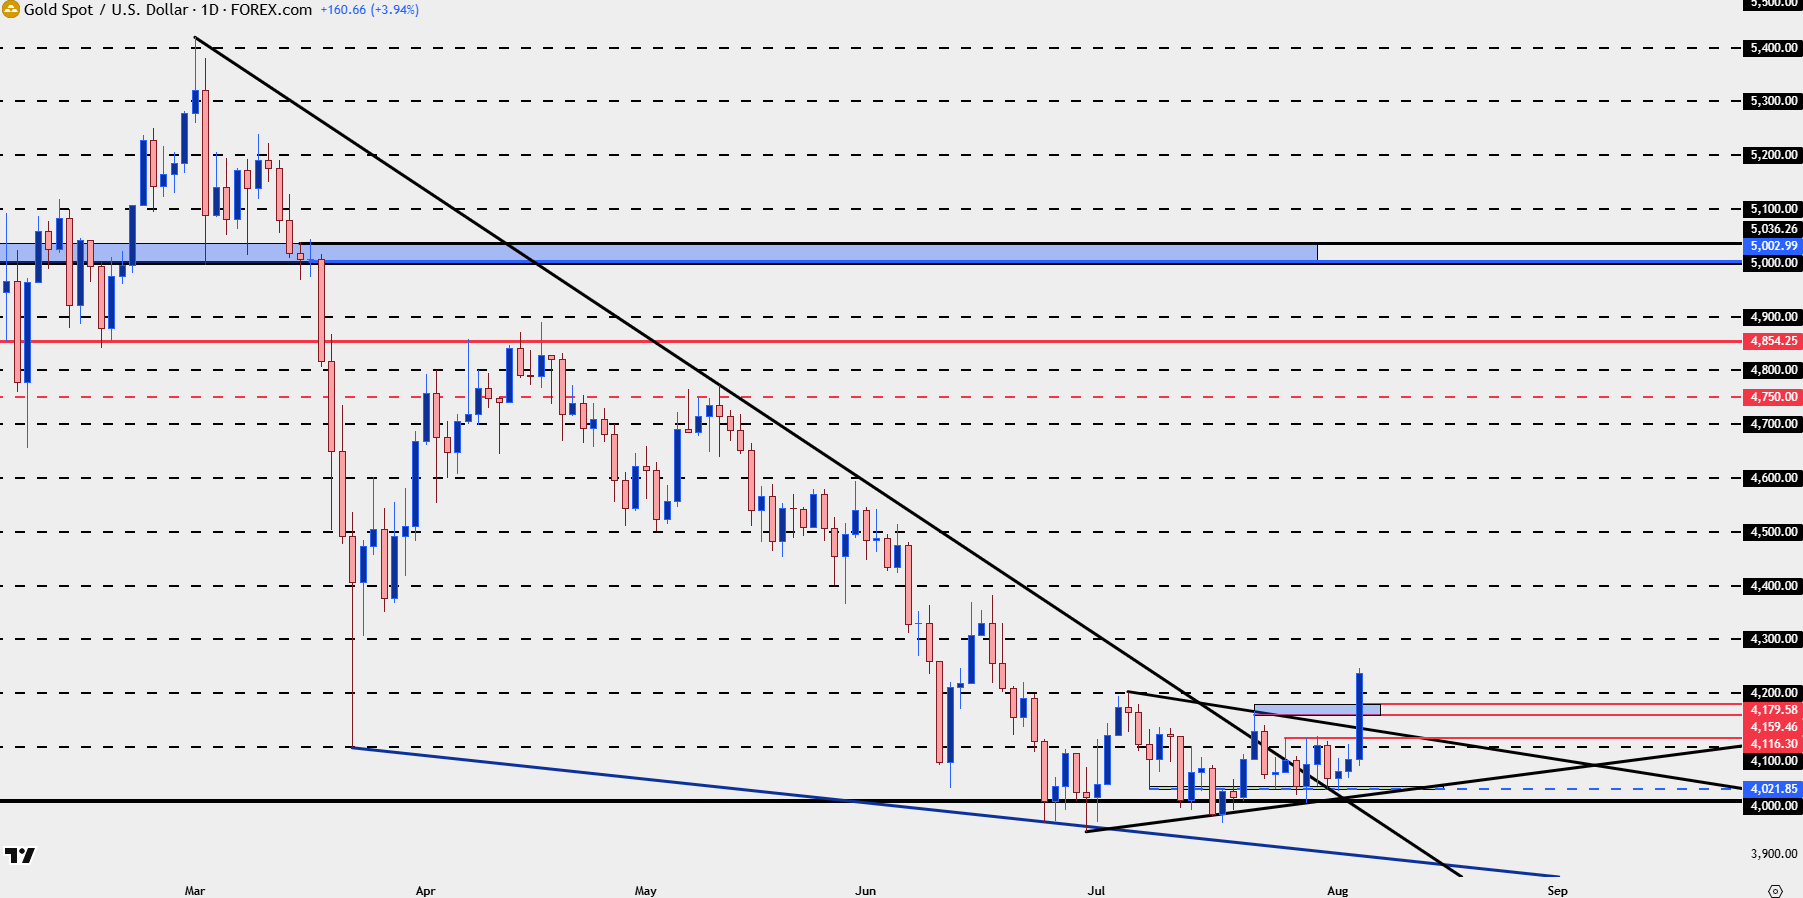
Chart prepared by James Stanley; data derived from Tradingview
--- written by James Stanley, Senior Market Analyst, Global Macro
Related tags:



The complete CFD trading experience
Award-winning platforms, competitive spreads, low commissions and dedicated support.
We live and breathe the markets and are dedicated to helping traders realise their ambitions as we continue to set the industry bar.
Economic calendar
Web Trader platform
Our sophisticated web-based platform is packed with features.
Related articles
Gold Price Forecast: XAU/USD Rebounds as Bulls Defend Critical Support 10 10 2026
Gold has bounced from a major inflection zone, but bulls still need follow-through as next week’s CPI report puts the recovery to the test.

US Dollar Price Action Setups: EUR/USD, USD/JPY, GBP/USD, USD/CAD
The US Dollar remained strong last week even as EUR/USD started to show a series of higher-lows. USD/JPY continues to be bought on dips as the fundamental deviation between the two economies remains front-and-center.

DAX, Gold and Bitcoin forecast: Dollar falls, yields retreat as risk appetite returns
Markets went from risk off to risk on yesterday afternoon and we have since kicked on with some follow-up buying of stocks, gold and silver, while the dollar has also shown signs of weakness. Risk appetite turned positive after bond yields and oil prices both retreated yesterday.

StoneX Europe Ltd may make third party material available on this website which may contain information included but not limited to the conditions of financial markets. The material is for information purposes only and does not contain, and should not be construed as containing, investment advice and/or investment recommendation and/or an investment research and/or an offer of or solicitation for any transactions in financial instruments; any decision to enter into a specific transaction shall be made by the client following an assessment by him/her of their situation.
StoneX Europe Ltd makes no representation or warranty and assumes no liability as to the accuracy or completeness of the information provided, nor any loss arising from any investment based on a recommendation, forecast or other information supplied. You should always seek independent advice as to your suitability to speculate in any related markets and your ability to assume the associated risks, if you are at all unsure. We are not under any obligation to update any such material. Any opinion made may be personal to the author and may not reflect the opinion of StoneX Europe Ltd.