



Gold, Silver, Crude Oil Outlook: Technical Analysis, Market Positioning
Gold, silver, and crude oil face diverging futures positioning. Bulls eye support levels, while bears tighten grip on oil.
Share this:

Precious metals and energy markets remain in the spotlight this week as traders weigh futures positioning, technical setups, and macro headwinds. Gold continues to struggle for momentum despite support from central bank demand, while silver shows signs of waning futures market conviction. Crude oil remains pressured by rising short bets, with the $60 handle once again in view.
View related analysis:
View related analysis:
Gold, Silver, and Crude Oil Futures Market Technical Analysis
Gold Futures (GC) Market Exposure
Price action on gold’s weekly chart has remained choppy since May, with prices failing to retest the record high set in April. (For clarity, I’m using adjusted futures contracts for long-term charts, whereas unadjusted contracts show a fresh record high was reached two weeks ago.)
Gold continues to draw support from central bank purchases, political turmoil, and concerns over Federal Reserve independence. Yet the inability to hold onto gains is something bulls should take seriously in the near term. My bias remains that a breakout is likely in due course, but for now gold is caught in a sideways correction where dips look preferable, and rallies should be approached with caution.
Net-long exposure to gold futures among managed funds and large speculators has been trending higher since early May, driven by rising gross longs while shorts have gradually declined. This positioning backdrop could support an eventual upside break, even though overall open interest has slipped lower through the quieter North American summer months.
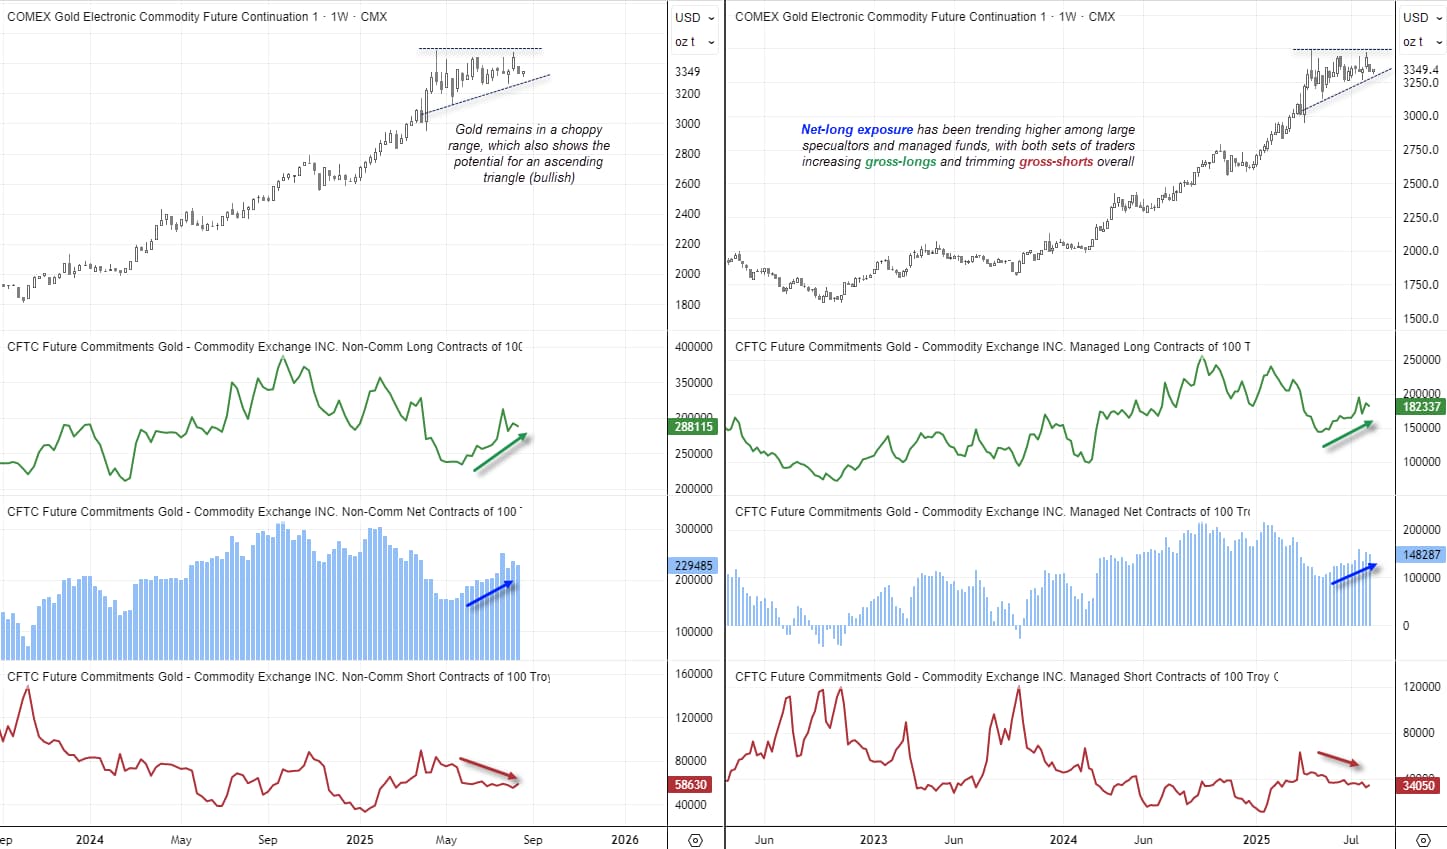
Chart analysis by Matt Simpson, Source: COMEX Futures, LSEG
Gold Futures (GC) Technical Analysis: Daily Chart, 4-Hour Chart
A bullish engulfing candle formed on gold’s daily chart, hinting at firm demand above 3350 — a level that has provided support twice since June. While the 50-day EMA is acting as resistance, I suspect gold may attract safe-haven demand in the lead-up to Jerome Powell’s Jackson Hole speech.
A decisive break above 3400 would clear the 50-day EMA and could trigger a momentum-led retracement of much of the recent decline.
The 4-hour chart also shows resistance around the monthly pivot, with RSI (2) recently hitting overbought territory, suggesting a minor pullback is possible. Still, bulls may look for an intraday swing low within Wednesday’s bullish engulfing range as a signal to position for a potential breakout above 3400 heading into Powell’s Jackson Hole appearance.

Chart analysis by Matt Simpson, Source: TradingView, COMEX Futures, Gold (GC1!)
Silver Futures (SI) Market Exposure
If gold prices manage to rally from here, silver could well follow. However, beyond the near term, silver is not my preferred bullish setup given the less favourable futures positioning backdrop. Net-long exposure among managed funds and large speculators has declined in recent weeks despite silver prices holding at elevated levels. Total open interest has also fallen, suggesting that silver’s rally may be losing momentum.
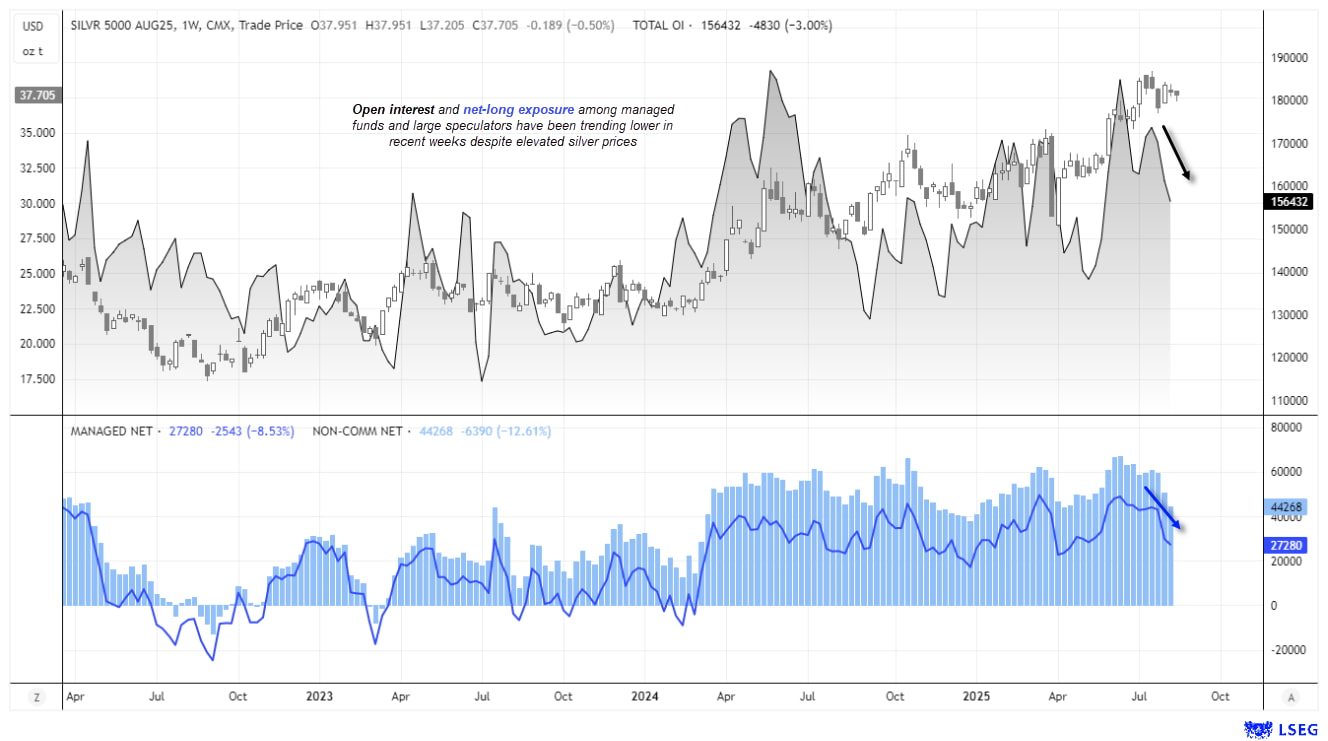
Chart analysis by Matt Simpson, Source: COMEX Futures, LSEG
Silver Futures (SI) Technical Analysis: Daily Chart
The daily chart shows that silver futures have found support at the 50-day EMA. A 2-bar bullish reversal pattern has also formed called a bullish piercing line. Bulls could seek dips towards the monthly pivot point (37.55) or 50-day EMA (37.3) in anticipation of a move up to the 38.87 high, near the monthly S1 pivot point.
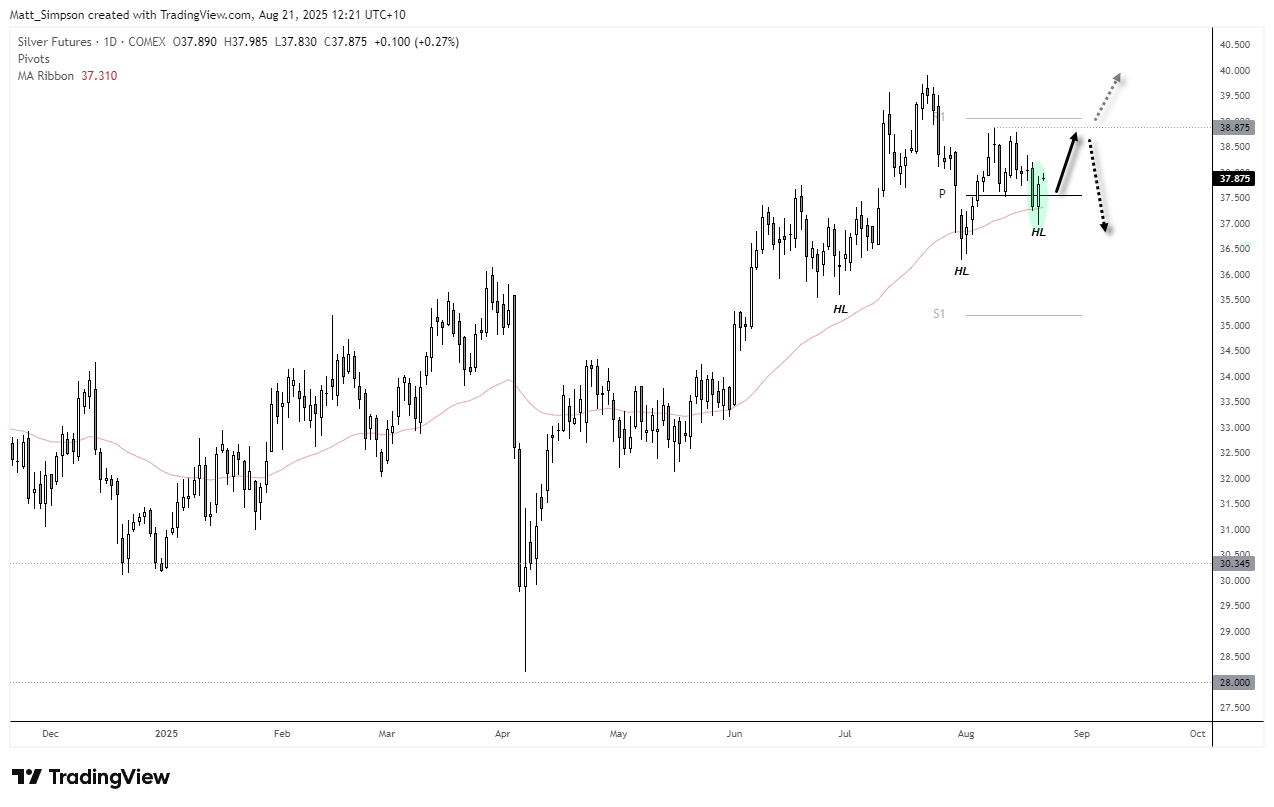
Chart analysis by Matt Simpson, Source: TradingView, COMEX Futures, Silver (SI1!)
WTI Crude Oil Futures (CL) Market Exposure
In my previous analysis, I suggested WTI crude oil could be headed for $60. Futures traders have since continued to reduce their net-long exposure, with both managed funds and large speculators adding to short bets while trimming longs. Rising open interest also reinforces the view that bears remain the dominant force, rather than this simply being a case of long covering.
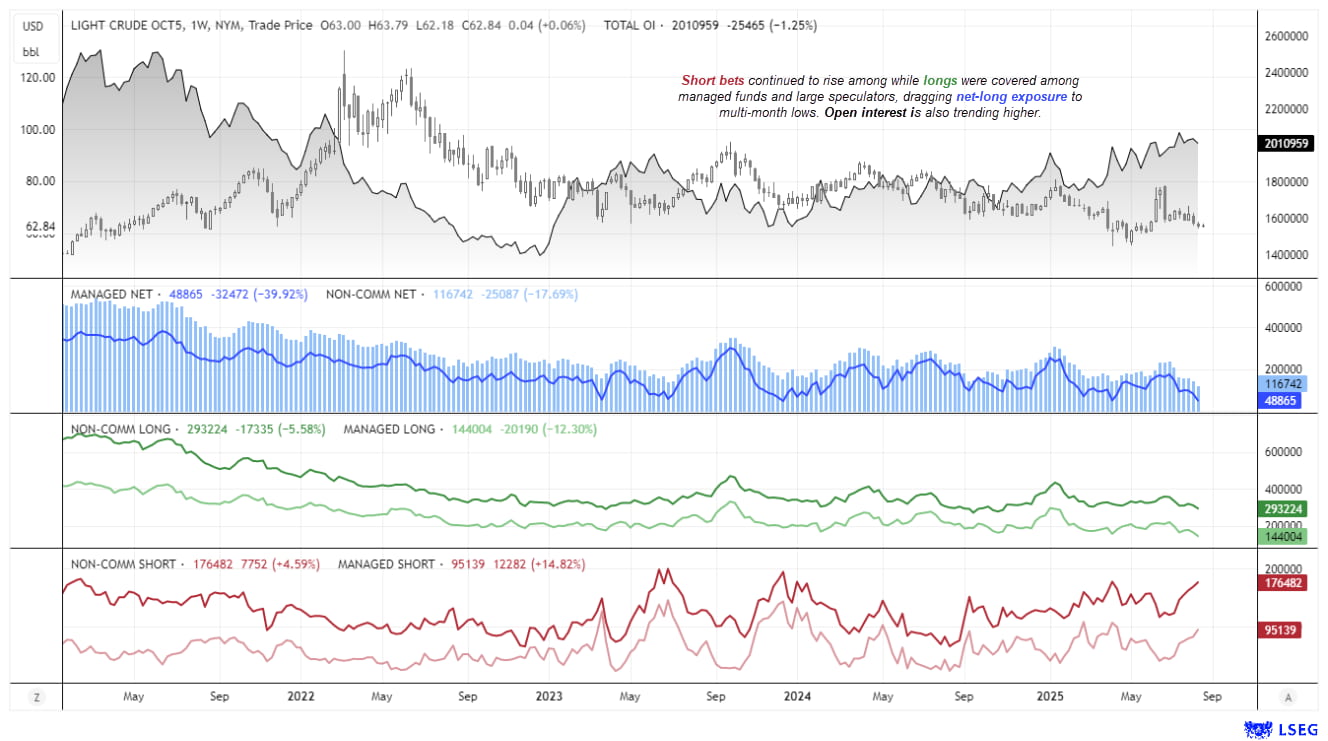
Chart analysis by Matt Simpson, Source: ICE Futures, LSEG
WTI Crude Oil Futures (CL) Technical Analysis: Daily Chart
This dynamic may see rallies in crude oil capped—if they materialise at all. However, with prices still holding above support near a weekly VPOC (~62) and the 61.8% Fibonacci projection, a modest bounce cannot be ruled out.
Should such a move occur, bears may be waiting to fade into strength, anticipating a test of—and potential break below—the $60 handle. For now, bulls could look for dips back towards Wednesday’s bullish range as a platform for a short-term pop higher, while bears may watch for evidence of a swing high on the daily chart (or lower) to position for a deeper move.
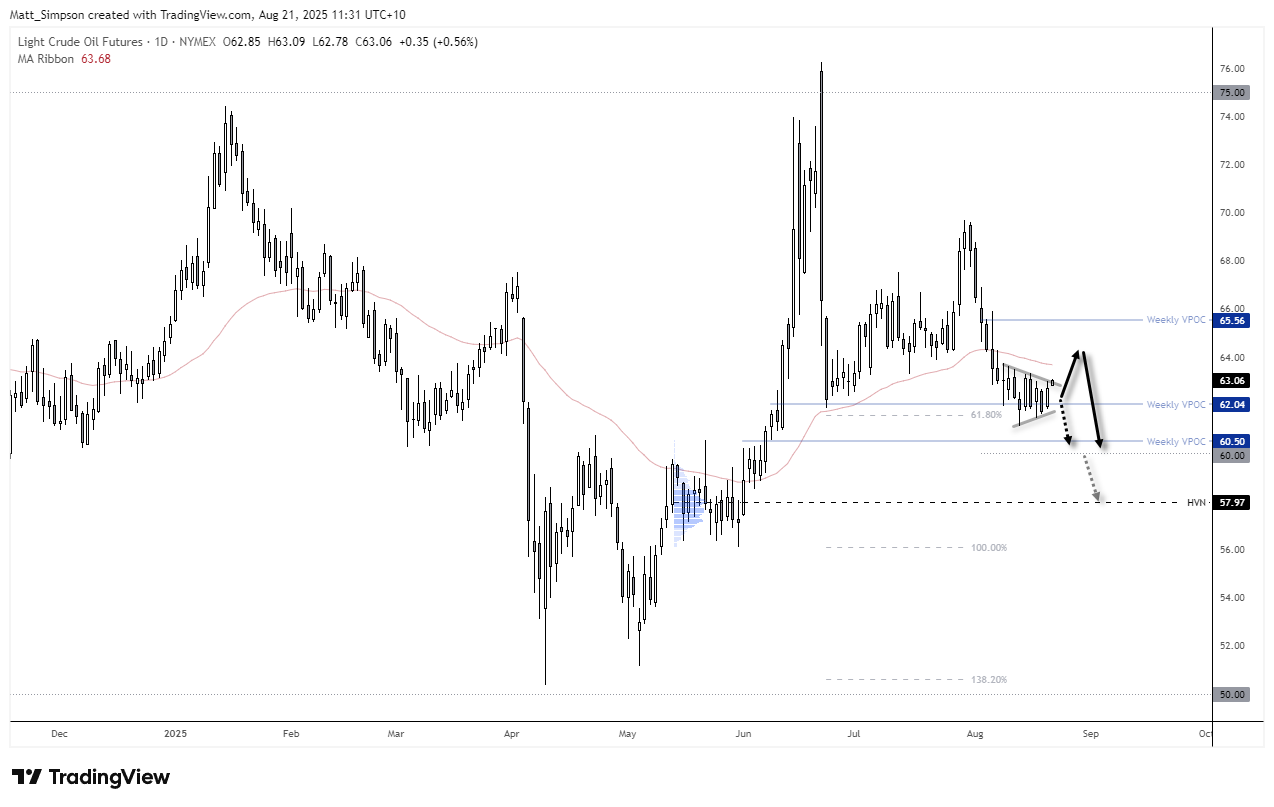
Chart analysis by Matt Simpson, Source: TradingView, ICE Futures, WTI Crude Oil (CL1!)
View the full economic calendar
View the full economic calendar
-- Written by Matt Simpson
Follow Matt on Twitter @cLeverEdge
How to trade with City Index
You can trade with City Index by following these four easy steps:
- Open an account, or log in if you’re already a customer
• Open an account in the UK
• Open an account in Australia
• Open an account in Singapore
- Search for the market you want to trade in our award-winning platform
- Choose your position and size, and your stop and limit levels
- Place the trade
Related tags:
Latest market news




The complete CFD trading experience
Award-winning platforms, competitive spreads, low commissions and dedicated support.
We live and breathe the markets and are dedicated to helping traders realise their ambitions as we continue to set the industry bar.
Economic calendar
Web Trader platform
Our sophisticated web-based platform is packed with features.
Related articles
Nasdaq 100 forecast: Tech stocks not out of woods yet
US index futures pushed higher in the first half of Friday’s session, taking cues from a strong performance from European equities. Both European and US equity futures extending yesterday’s impressive recovery after the sharp sell-off earlier in the week. But the lingering concerns around the AI investment cycle remain, while bond markets were easing lower again, lifting yields.


ASX 200 Outlook: A Rates Trade Disguised as a Stock Market?
Australian bond futures have exhibited a far stronger relationship with the ASX 200 than Wall Street over recent months. Now both markets are displaying remarkably similar price structures.


AUD/USD Bulls Fight Back After Australian Jobs Shock
AUD/USD has been hit by another ugly Australian employment report, sending RBA rate hike expectations sharply lower. Yet the relationships driving the currency have shifted since quarter-end, and improving risk appetite could provide the fuel for a recovery.
StoneX Europe Ltd may make third party material available on this website which may contain information included but not limited to the conditions of financial markets. The material is for information purposes only and does not contain, and should not be construed as containing, investment advice and/or investment recommendation and/or an investment research and/or an offer of or solicitation for any transactions in financial instruments; any decision to enter into a specific transaction shall be made by the client following an assessment by him/her of their situation.
StoneX Europe Ltd makes no representation or warranty and assumes no liability as to the accuracy or completeness of the information provided, nor any loss arising from any investment based on a recommendation, forecast or other information supplied. You should always seek independent advice as to your suitability to speculate in any related markets and your ability to assume the associated risks, if you are at all unsure. We are not under any obligation to update any such material. Any opinion made may be personal to the author and may not reflect the opinion of StoneX Europe Ltd.