



WTI Crude Oil Outlook: Bearish Momentum Mounts, COT Data Sends Warning
WTI crude oil slips below key support as bearish momentum accelerates. COT data warns of a potential sentiment extreme despite short-term downside risk.
Share this:

Oil prices have fallen nearly 10% since the July high. OPEC’s increased output and hopes that talks between Trump and Putin could result in lower oil sanction on Russia have helped weigh on crude oil, and price action on the weekly chart suggests there could be more downside to follow before a cycle low is set.
View related analysis:
View related analysis:
WTI Crude Oil Futures (CL) Technical Analysis, COT Positioning
WTI crude oil futures have been range-bound for the past two and a half years, trading between $50 and $80. Over the past 18 months, price action has been confined to a tighter $57–$75 band.
Momentum is now turning bearish. A pronounced bearish engulfing week marked a key top and a false breakout above $75. A potential bear flag has also formed around the 200-week moving averages. With WTI crude oil futures now trading below both the 200-week SMA and EMA, positioned in the lower half of the range, and momentum pointing lower, the technical outlook suggests scope for further downside — with $60 as a potential target.

Chart analysis by Matt Simpson, Source: TradingView, ICE Futures, WTI Crude Oil
WTI Crude Oil Futures (CL) Daily chart
WTI crude has just posted its most bearish streak since August 2021, with seven straight daily losses culminating in Friday’s doji low. This pattern raises the probability of at least a short-term rebound. Adding to the case, the daily RSI (2) is curling higher from oversold territory, while Monday formed a bullish inside day just beneath the 200-day averages.
My near-term bias is for a bounce toward the weekly volume point of control (VPOC) at $65.56. A break above this level would bring the monthly pivot point near $68 into focus. However, with the weekly chart still pointing lower, the broader strategy is to look for signs of a swing high on the daily timeframe — should prices rally as expected — to align with the longer-term bearish outlook.
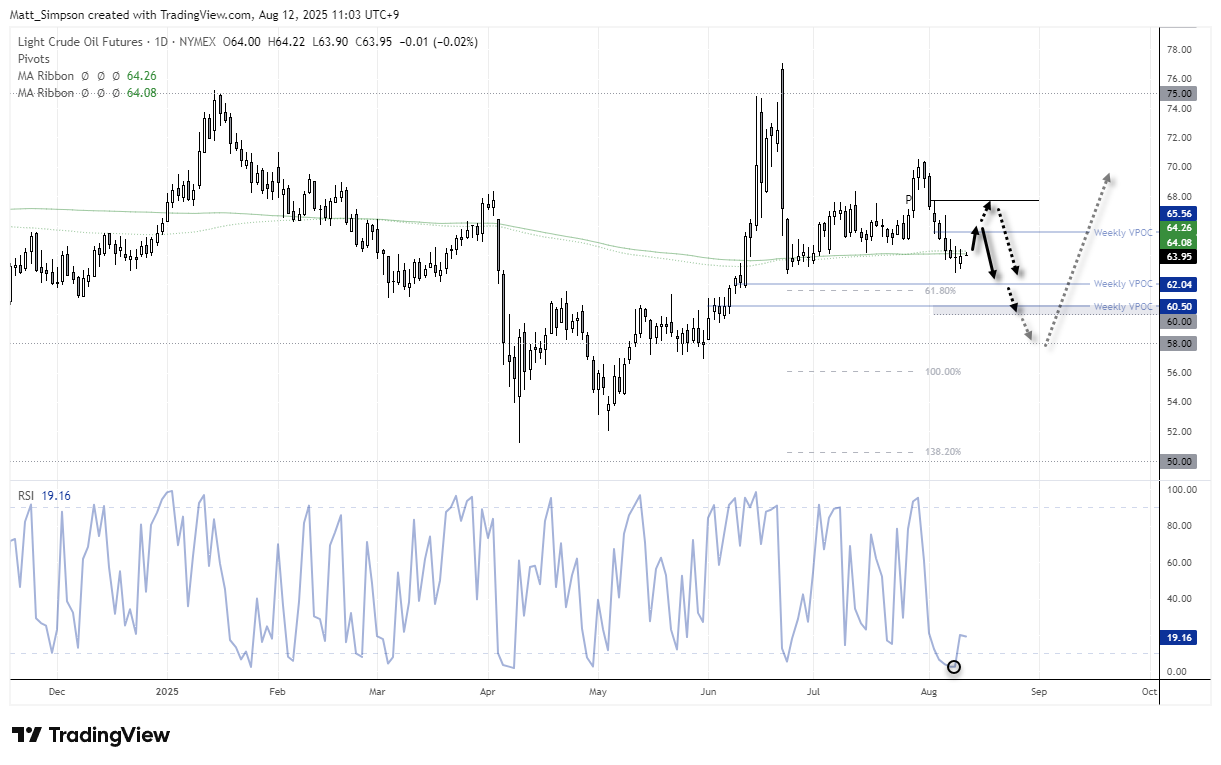
Chart analysis by Matt Simpson, Source: TradingView, ICE Futures, WTI Crude Oil
WTI Crude Oil Positioning (CL): Weekly COT Report Analysis
Net-long exposure among large speculators has dropped to a 17-week low, driven by a surge in short positions against crude oil. Gross shorts have been trending higher since mid-May, while gross longs remain relatively subdued — sitting at roughly half the level of gross shorts.
Although this setup is not particularly bullish in the near term, it is interesting to note that net-long exposure has rarely stayed below 150,000 contracts over the past 15 years. With gross longs now approaching their 2025 peak set in April, there remains a mild risk of a sentiment extreme forming.
This doesn’t justify a strong bullish case just yet, but traders may want to be cautious about assuming much lower prices from here. Though a move to $60 still remains a plausible path.
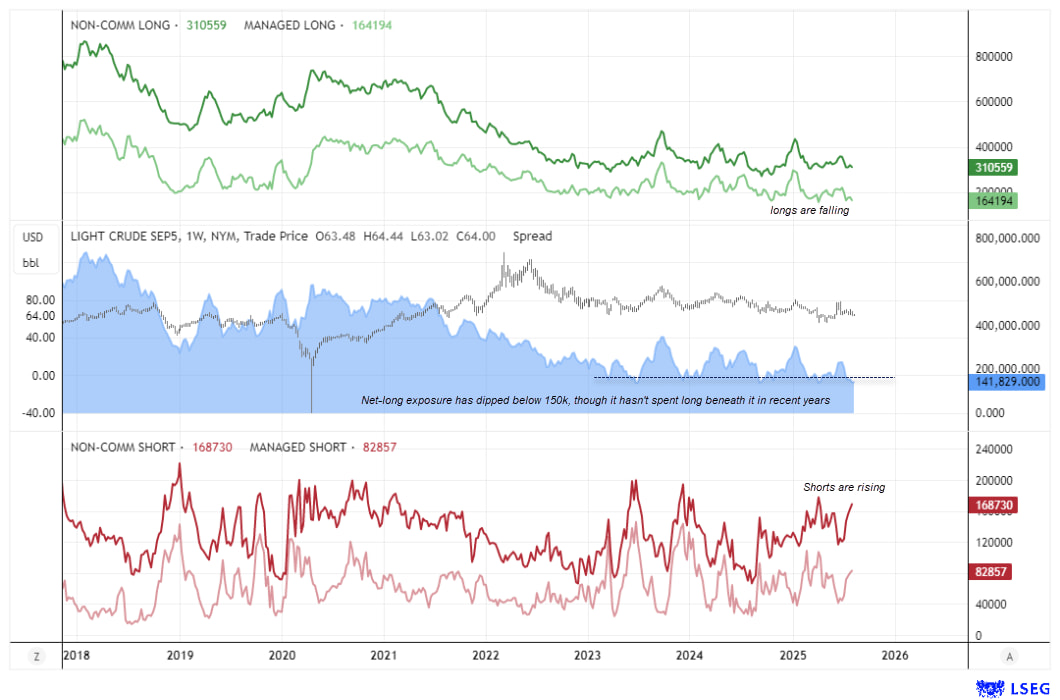
Chart analysis by Matt Simpson - Source: CME, LSEG
View the full economic calendar
View the full economic calendar
-- Written by Matt Simpson
Follow Matt on Twitter @cLeverEdge
How to trade with City Index
You can trade with City Index by following these four easy steps:
- Open an account, or log in if you’re already a customer
• Open an account in the UK
• Open an account in Australia
• Open an account in Singapore
- Search for the market you want to trade in our award-winning platform
- Choose your position and size, and your stop and limit levels
- Place the trade
Related tags:
Latest market news




The complete CFD trading experience
Award-winning platforms, competitive spreads, low commissions and dedicated support.
We live and breathe the markets and are dedicated to helping traders realise their ambitions as we continue to set the industry bar.
Economic calendar
Web Trader platform
Our sophisticated web-based platform is packed with features.
Related articles
StoneX Europe Ltd may make third party material available on this website which may contain information included but not limited to the conditions of financial markets. The material is for information purposes only and does not contain, and should not be construed as containing, investment advice and/or investment recommendation and/or an investment research and/or an offer of or solicitation for any transactions in financial instruments; any decision to enter into a specific transaction shall be made by the client following an assessment by him/her of their situation.
StoneX Europe Ltd makes no representation or warranty and assumes no liability as to the accuracy or completeness of the information provided, nor any loss arising from any investment based on a recommendation, forecast or other information supplied. You should always seek independent advice as to your suitability to speculate in any related markets and your ability to assume the associated risks, if you are at all unsure. We are not under any obligation to update any such material. Any opinion made may be personal to the author and may not reflect the opinion of StoneX Europe Ltd.