





WTI Crude Oil Forecast: Can Prices Rebound or Is Another Leg Lower Ahead?
Crude oil prices reversed sharply after a 47% rally. Can WTI crude oil bounce from key support or is another drop looming?
Share this:

WTI crude oil saw a sharp 47% rally from the May low to the June high — but the fact that half of that move was unwound in just two sessions shouldn't be ignored. This rapid reversal raises the risk of another dip lower for crude oil prices, especially given the magnitude of the decline relative to the prior rally.
That said, short-term momentum has turned higher from a key support zone, favouring an initial bounce — something crude oil bears may want to monitor for signs of a swing high next week.
View related analysis:
View related analysis:
Independence Day and OPEC Meeting Incoming
Please note that trading hours will be reduced due to the US Independence Day holiday. While exact times may vary by platform, US futures markets are expected to close at 12:00 PM EST on Friday and reopen at their usual time on Sunday night (Monday morning in Asia).
Also of note is the upcoming OPEC+ meeting on Sunday, which could trigger price gaps for WTI crude oil at Monday’s open. The market currently expects the oil cartel to announce an additional production increase of 411k barrels per day — a move that could limit upside potential for crude oil prices. However, any deviation from this guidance could surprise markets and fuel additional volatility.
WTI Crude Oil Technical Analysis: Support Levels in Play
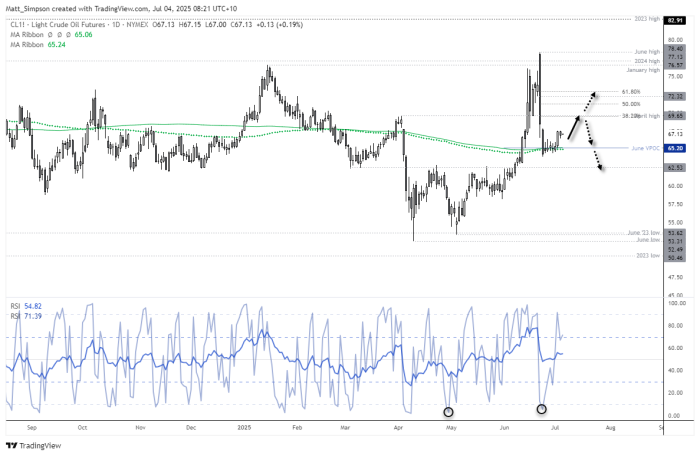
Chart analysis by Matt Simpson, Source: TradingView, ICE Futures, WTI Crude Oil
WTI crude oil has consolidated above the post-Israel–Iran ceasefire low, with price action holding near the $65 handle — a zone that also captures the 200-day EMA, 200-day SMA, and June’s volume point of control (VPOC).
The RSI (2) also reached its most oversold level since late April on June 24, suggesting that an interim swing low could be in place for crude oil.
WTI Crude Oil Trade Setup: Key Levels to Watch
• Bullish Scenario: Traders may seek dips above recent cycle lows or around $65 for tighter risk, targeting the April high near $69.65 in the short term.
• Bearish Scenario: A swing high around the 50–78.6% Fibonacci retracement levels (up to $72.50) could offer selling opportunities, with potential for crude oil prices to eventually break below the 200-day averages and revisit the $60 zone.
View the full economic calendar
View the full economic calendar
-- Written by Matt Simpson
Follow Matt on Twitter @cLeverEdge
How to trade with City Index
You can trade with City Index by following these four easy steps:
- Open an account, or log in if you’re already a customer
• Open an account in the UK
• Open an account in Australia
• Open an account in Singapore
- Search for the market you want to trade in our award-winning platform
- Choose your position and size, and your stop and limit levels
- Place the trade
Related tags:
Latest market news




The complete CFD trading experience
Award-winning platforms, competitive spreads, low commissions and dedicated support.
We live and breathe the markets and are dedicated to helping traders realise their ambitions as we continue to set the industry bar.
Economic calendar
Web Trader platform
Our sophisticated web-based platform is packed with features.
Related articles
Gold Analysis: XAU/USD Ends the Week Without a Clear Trend
The trading week is coming to an end, and a sense of neutrality remains evident around gold's short-term price action. Over the last five trading sessions, the metal has posted a move of barely -0.3%, a situation that continues to highlight a growing phase of indecision and reflects a clear lack of direction across the market.

Gold Price Short-term Outlook: XAU/USD Holds Critical Support as Breakout Nears 10 15 2026
Gold is consolidating after a steep selloff, with momentum divergence raising the stakes for the next move ahead of the Fed decision.


Silver Analysis: XAG/USD Falls Back to Annual Lows
Recent sessions have been particularly challenging for silver prices in the short term. Selling pressure has intensified considerably, resulting in three consecutive losing sessions and pushing the metal to a decline of nearly 8.5% over this period.
StoneX Europe Ltd may make third party material available on this website which may contain information included but not limited to the conditions of financial markets. The material is for information purposes only and does not contain, and should not be construed as containing, investment advice and/or investment recommendation and/or an investment research and/or an offer of or solicitation for any transactions in financial instruments; any decision to enter into a specific transaction shall be made by the client following an assessment by him/her of their situation.
StoneX Europe Ltd makes no representation or warranty and assumes no liability as to the accuracy or completeness of the information provided, nor any loss arising from any investment based on a recommendation, forecast or other information supplied. You should always seek independent advice as to your suitability to speculate in any related markets and your ability to assume the associated risks, if you are at all unsure. We are not under any obligation to update any such material. Any opinion made may be personal to the author and may not reflect the opinion of StoneX Europe Ltd.