





How the Russell 2000 brushed off events in China to set up a period of outperformance
The last day of the trading month is upon us, finishing off a busy week that included earnings from “Big Tech” stocks, important US economic updates, and a stomach-churning ~10% fall in Chinese stock indices.
Share this:

Gold
The Federal Reserve's hawkish pivot at the June FOMC meeting sent gold sharply lower from above $1850 to a low of $1751. The sell-off, a function of gold's negative correlation with rising US real yields/interest rates and a stronger US dollar.
Since then, the US dollar has failed to break higher and is showing signs of upside fatigue. As viewed on the chart below, US 5 year real yields have fallen back to record lows, leaving gold trading exceptionally cheap on this metric.
However, investor's attitudes towards gold remain cautious, as witnessed by golds close back below $1800 overnight. Likely reflecting an expectation that real yields will push higher as the labour market improves in September after unemployment benefits expire nationally.
Technically while gold remains above trendline support at $1750, we will give the uptrend in gold the benefit of the doubt, needing a rally above $1834 to suggest a more robust recovery towards $1900 can unfold. Aware that should gold first slip below support at $1750ish, a deeper sell-off towards $1600 is likely.
Copper
The recent slowdown in China has been a headwind to copper, offset by strong demand from the rest of the world, moving further along the clean energy investment cycle.
An example of this, three times as much copper is used in electric vehicles than conventional internal combustion engines. However new copper supply has stagnated since 2016, leaving the market structurally undersupplied.
This dynamic is behind the sharp move higher in copper this week, in line with expectations, we wrote about here two weeks ago. Thereby providing an excellent example of a trade idea supported by bullish fundamentals and technical' s.
However, it is not over yet, and providing copper does not retrace back below support at $4.40ish, the expectation is for a test and break of the May $4.88 high.
Source Tradingview. The figures stated areas of the 27th of July 2021. Past performance is not a reliable indicator of future performance. This report does not contain and is not to be taken as containing any financial product advice or financial product recommendation
A fall of this magnitude in Chinese stocks would have flowed through into other regional capital markets in days gone past. One of my best days of trading ever was pre the GFC while part of the proprietary trading team at Goldman’s in Sydney after a 10% fall in the Shanghai Composite.
At the time, I had a good-sized long position in 3yr SFE bond futures calls that were worth considerably more the next day, benefitting from a flight to safety as global equity markets crumbled due to contagion fears.
This time around, key US equity indices have remained undeterred by this week's events in China, trading at or near to record highs. A reflection of the modern-day realisation that China is still not integrated into global markets.
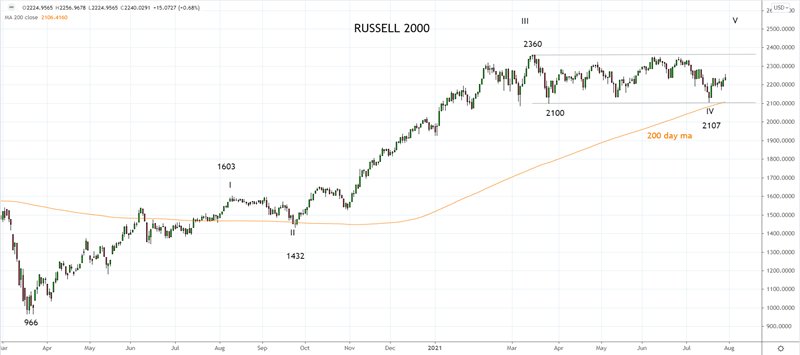
Notably, this week, the “small cap” Russell 2000 outperformed its bigger brothers, the S&P500 and the Nasdaq. The last time the Russell saw a period of significant outperformance was following Joe Bidens election victory and the arrival of vaccines in November 2020, through until March 2021.
However, since early March, the Russell 2000 has marked time, trading sideways in a range between 2350 and 2100. Potentially the recent bottoming in US yields, which supports small cap value stocks, along with stretched valuations in tech, is ushering in a new period of outperformance for small caps.
>From a technical perspective, charts don’t get much better than the Russell 2000 currently. It appears to have completed a correction from the March 2360 high at the recent 2107 low, just above the 200-day ma.
From here, a test of range highs at 2360 is expected, before a push to fresh all-time highs near 2600, which would then complete an Elliott Wave, five-wave advance from the pandemic low of 966.
Source Tradingview. The figures stated areas of the 30th of July 2021. Past performance is not a reliable indicator of future performance. This report does not contain and is not to be taken as containing any financial product advice or financial product recommendation


The complete CFD trading experience
Award-winning platforms, competitive spreads, low commissions and dedicated support.
We live and breathe the markets and are dedicated to helping traders realise their ambitions as we continue to set the industry bar.
Economic calendar
Web Trader platform
Our sophisticated web-based platform is packed with features.
Related articles

AUD/USD hammered by US yields and fading RBA hike bets
US yields, dollar strength and fading RBA hike bets have combined to drive AUD/USD to fresh multi-month lows. The macro and technical bias remains bearish, although history suggests parts of the move are now reaching unusually stretched levels.

EUR/USD Forecast: Euro Struggles to Find Support Even After U.S. PCE Data
The euro continues to face a challenging environment in the short term. The currency has struggled to regain ground against a U.S. dollar that remains firmly supported, a dynamic reflected in EUR/USD, which has now recorded three consecutive losing sessions and a decline of roughly 0.6%.


Canadian Dollar Forecast: USD/CAD Four-Week Rally Eyes Yearly Highs 9 30 2026
USD/CAD has advanced in 14 of the past 15 sessions, but stretched momentum raises the stakes as major resistance and NFP come into focus.

StoneX Europe Ltd may make third party material available on this website which may contain information included but not limited to the conditions of financial markets. The material is for information purposes only and does not contain, and should not be construed as containing, investment advice and/or investment recommendation and/or an investment research and/or an offer of or solicitation for any transactions in financial instruments; any decision to enter into a specific transaction shall be made by the client following an assessment by him/her of their situation.
StoneX Europe Ltd makes no representation or warranty and assumes no liability as to the accuracy or completeness of the information provided, nor any loss arising from any investment based on a recommendation, forecast or other information supplied. You should always seek independent advice as to your suitability to speculate in any related markets and your ability to assume the associated risks, if you are at all unsure. We are not under any obligation to update any such material. Any opinion made may be personal to the author and may not reflect the opinion of StoneX Europe Ltd.