




Japanese yen analysis: USD/JPY uptrend intact as bulls eye 138.00
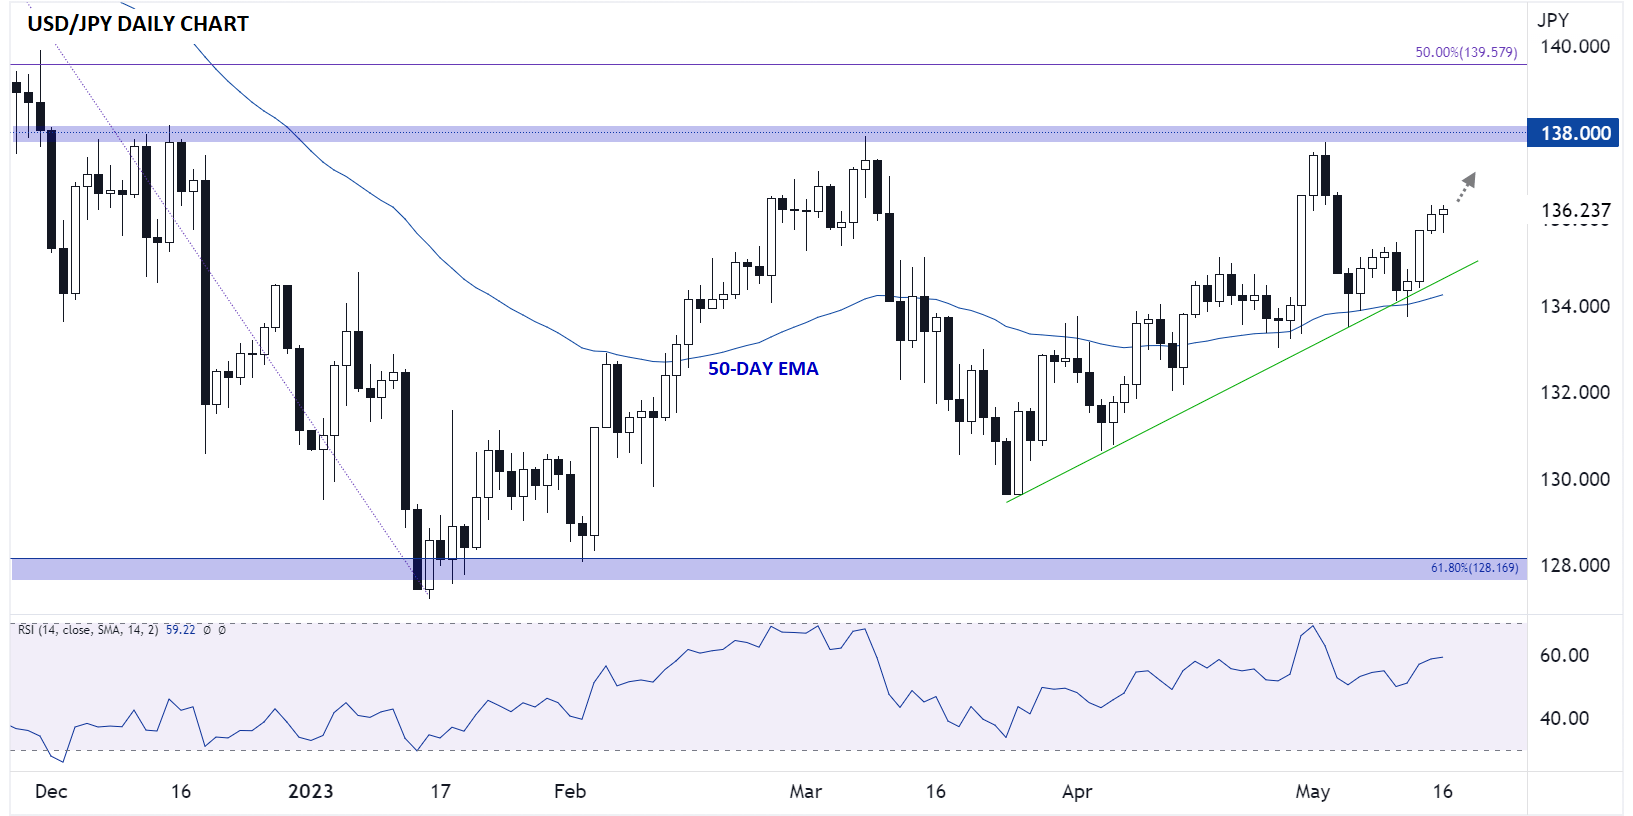
USD/JPY remains in an uptrend after testing rising trend line support and the 50-day EMA midway through last week.
Share this:

Japanese yen takeaways
- Traders will get the latest updates on Q1 GDP, Industrial Production, Trade Balance, and National CPI data out of Japan over the next 48 hours.
- USD/JPY found support at its rising trend line and 50-day EMA last week, keeping the near-term bullish bias intact.
- The next resistance level to watch will be the year-to-date high near 138.00.
Japanese yen fundamental analysis
Ahead of this weekend’s G7 summit in Hiroshima, it’s a big week for Japanese economic data. Over the next 48 hours, traders will be treated to the latest updates on Q1 GDP, Industrial Production, Trade Balance, and National CPI data.
Outside of traditional economic data, it’s also notable that the Prime Minister Kishida has called for the BOJ to exam the sustainability of recent wage increases, a possible precursor to an eventual hawkish shift in monetary and/or fiscal policy, though like everything in Japan, that may take longer than many traders would hope to bear fruit.
Source: StoneX
Japanese yen technical analysis – USD/JPY daily chart
Turning our attention to the daily chart of USD/JPY, rates remain in an uptrend after testing rising trend line support and the 50-day EMA midway through last week. Today’s rally is particularly impressive given this morning’s lackluster US data, with retail sales rising by just 0.4% month-over-month, half of the projected 0.8% gain:
Source: Tradingview, StoneX
Moving forward, USD/JPY has little in the way of nearby resistance, and bulls may therefore look to drive the pair back toward its year-to-date high near 138.00, especially if Japanese economic data comes in worse than expected. At this point, only a bearish reversal back down below the confluence of the rising trend line and 50-day EMA near 134.50 would erase the current bullish bias and open the door for additional losses.
-- Written by Matt Weller, Global Head of Research
Follow Matt on Twitter: @MWellerFX
How to trade with City Index
You can trade with City Index by following these four easy steps:
- Open an account, or log in if you’re already a customer
• Open an account in the UK
• Open an account in Australia
• Open an account in Singapore
- Search for the market you want to trade in our award-winning platform
- Choose your position and size, and your stop and limit levels
- Place the trade
Related tags:

The complete CFD trading experience
Award-winning platforms, competitive spreads, low commissions and dedicated support.
We live and breathe the markets and are dedicated to helping traders realise their ambitions as we continue to set the industry bar.
Economic calendar
Web Trader platform
Our sophisticated web-based platform is packed with features.
Related articles

USD/JPY weekly outlook: Quarter turn scrambles rates regime
USD/JPY’s tight relationship with front-end US rates broke down sharply last week, but quarter-turn flows and positioning suggest the disconnect may prove temporary.


USD/CAD forecast: rally could accelerate above June highs at 1.4250
USD/CAD recovered quickly after weaker US jobs data, keeping the bullish trend in focus. A move above the June highs could accelerate the rally as inflation keeps the Fed under pressure.


USD Sets Fresh Yearly High as EUR/USD Drops Dramatically, USD/JPY Stable
Well, it was a week of USD strength that wasn’t entirely pushed by USD/JPY, as a strong sell-off in EUR/USD has pushed the major pair to its most oversold state in a decade.

StoneX Europe Ltd may make third party material available on this website which may contain information included but not limited to the conditions of financial markets. The material is for information purposes only and does not contain, and should not be construed as containing, investment advice and/or investment recommendation and/or an investment research and/or an offer of or solicitation for any transactions in financial instruments; any decision to enter into a specific transaction shall be made by the client following an assessment by him/her of their situation.
StoneX Europe Ltd makes no representation or warranty and assumes no liability as to the accuracy or completeness of the information provided, nor any loss arising from any investment based on a recommendation, forecast or other information supplied. You should always seek independent advice as to your suitability to speculate in any related markets and your ability to assume the associated risks, if you are at all unsure. We are not under any obligation to update any such material. Any opinion made may be personal to the author and may not reflect the opinion of StoneX Europe Ltd.