



Japanese Yen Intervention: Volatility Fades, But Turning Points Emerge
USD/JPY plunged nearly 500 pips as suspected MOF intervention hit the market. While volatility typically fades after the initial shock, history shows these events often coincide with major turning points.
Share this:

Traders cannot say Thursday’s surge in the Japanese yen came without warning. Japan’s top FX diplomat had already issued what he called a “final warning” just hours earlier. The near 500-pip drop in USD/JPY certainly fits the profile of a classic intervention by the Ministry of Finance Japan—although, as is typical, official confirmation has yet to come.
Naturally, this has traders on edge for a potential second wave of volatility. But officials would likely need to be provoked again for moves of that magnitude to repeat. Besides, history suggests volatility tends to diminish after the initial intervention.
When you watch charts all day, you develop a feel for how volatility behaves around major events. Still, it pays to run the numbers—and in this case, they back it up.
View related analysis:
View related analysis:
Japanese Yen Intervention: Volatility Patterns and Market Impact
Volatility in the Japanese yen peaks on the day of intervention, then fades in the sessions that follow. The sample size may be small and well below the textbook 30, but the pattern is clear: an initial spike in volatility followed by compression and choppier trade.
- USD/JPY averages a -1.2% decline on intervention day (median -1.45%)
- The average daily range expands to ~3.1% (median 3.33%)
- There is no strong directional bias from T+1 to T+6, reinforcing the idea of consolidation rather than trend
- Daily ranges steadily contract after T+0

Source: LSEG
This isn’t unique to intervention. You see similar behaviour after most market shocks: volatility explodes on impact, then fades as traders regroup and reassess positioning. However, just because volatility diminishes does not mean there is no impact, as intervention usually preceded turning points on USD/JPY.


USD/JPY Technical Analysis: US Dollar vs Japanese Yen
Intervention and Turning Points on USD/JPY
Zooming out, intervention tends to coincide with meaningful turning points, regardless of the underlying fundamentals. Of the four major interventions between 2022 and 2024, three aligned with significant reversals. The remaining case saw USD/JPY rebound after an initial ~850-pip drop, but even then it took around two months to break above the prior intervention high—ultimately triggering another intervention and a broader -13.7% downtrend of over 2,200 pips.

Source: ICE, TradingView
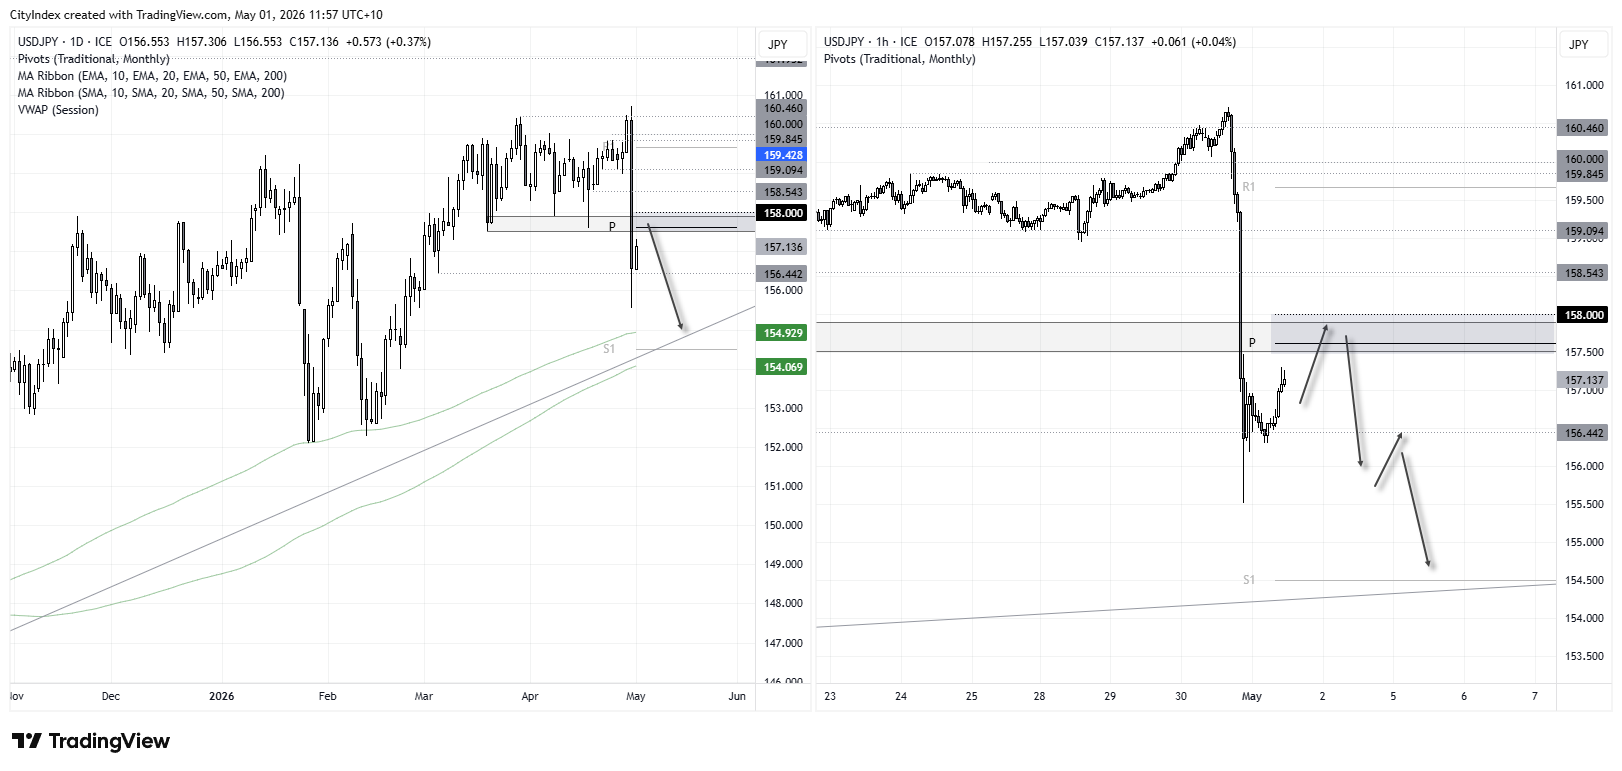
USD/JPY Short-Term Outlook: Bearish Bias Below 158
The daily chart shows a clear bearish engulfing candle, with prices retracing from the lows during today’s Asian session. But with the monthly pivot, range lows and the 158 handle nearby as potential resistance, it almost invites bears to fade into strength.
The 1-hour chart shows momentum pushing higher into that zone, but unless traders are keen to goad the MOF into further action, my bias is for a swing high to form just below—or around—the 158 area.
Note the 200-day averages and long term bullish trendline that could become bearish targets, should momentum roll over once more.
Source: ICE, TradingView
View the full economic calendar
View the full economic calendar
-- Written by Matt Simpson
Follow Matt on Twitter @cLeverEdge
How to trade with City Index
You can trade with City Index by following these four easy steps:
- Open an account, or log in if you’re already a customer
• Open an account in the UK
• Open an account in Australia
• Open an account in Singapore
- Search for the market you want to trade in our award-winning platform
- Choose your position and size, and your stop and limit levels
- Place the trade
Related tags:
Latest market news




The complete CFD trading experience
Award-winning platforms, competitive spreads, low commissions and dedicated support.
We live and breathe the markets and are dedicated to helping traders realise their ambitions as we continue to set the industry bar.
Economic calendar
Web Trader platform
Our sophisticated web-based platform is packed with features.
Related articles

Gold Slips as Crude Oil Surges on Middle East Tensions
Gold weakens despite geopolitical risks as crude oil volatility surges on Middle East tensions. Traders watch $5,000 support on gold and $100 for Brent.

Australian Dollar Mixed as CPI Falls Short of Guaranteeing RBA Hike
Australian CPI remains above target, but easing yield expectations and a pre-CPI AUD rally leave markets unconvinced a February RBA hike is locked in.

Gold Futures Look Set To Bounce From 4000, Though Headwinds Remain
Gold futures are showing signs of a short-term bounce off 4000, but mixed options flows and resistance overhead suggest the recovery may be limited.
StoneX Europe Ltd may make third party material available on this website which may contain information included but not limited to the conditions of financial markets. The material is for information purposes only and does not contain, and should not be construed as containing, investment advice and/or investment recommendation and/or an investment research and/or an offer of or solicitation for any transactions in financial instruments; any decision to enter into a specific transaction shall be made by the client following an assessment by him/her of their situation.
StoneX Europe Ltd makes no representation or warranty and assumes no liability as to the accuracy or completeness of the information provided, nor any loss arising from any investment based on a recommendation, forecast or other information supplied. You should always seek independent advice as to your suitability to speculate in any related markets and your ability to assume the associated risks, if you are at all unsure. We are not under any obligation to update any such material. Any opinion made may be personal to the author and may not reflect the opinion of StoneX Europe Ltd.