



Gold Futures Look Set To Bounce From 4000, Though Headwinds Remain
Gold futures are showing signs of a short-term bounce off 4000, but mixed options flows and resistance overhead suggest the recovery may be limited.
Share this:

Gold futures are attempting to stabilise above the 4000 level after a sharp pullback, with early signs that a short-term rebound may be forming. Options markets show medium-term bullish positioning, yet short-dated skews remain negative — hinting that gains could be capped initially. Technicals on the weekly and daily charts point to a potential recovery phase, but multiple resistance layers suggest that bulls may still face challenges before any sustained move higher.
View related analysis:
View related analysis:
Gold options traders display a mixed message
Risk reversals track the balance between bullish call demand and bearish put demand, with a rising line signalling expectations of higher prices. Notably, the 1- and 3-month RRs broke to new cycle highs last week ahead of spot, hinting that options traders may be positioning for gold to eventually break higher over those timeframes.
The 1-week RR, however, remains negative — showing puts still outweigh calls in the very near term. Short-dated signals are noisy, but it’s a reminder not to assume an immediate runaway breakout. Even so, a tactical long setup could be forming, even if gold initially struggles to clear last week’s high.
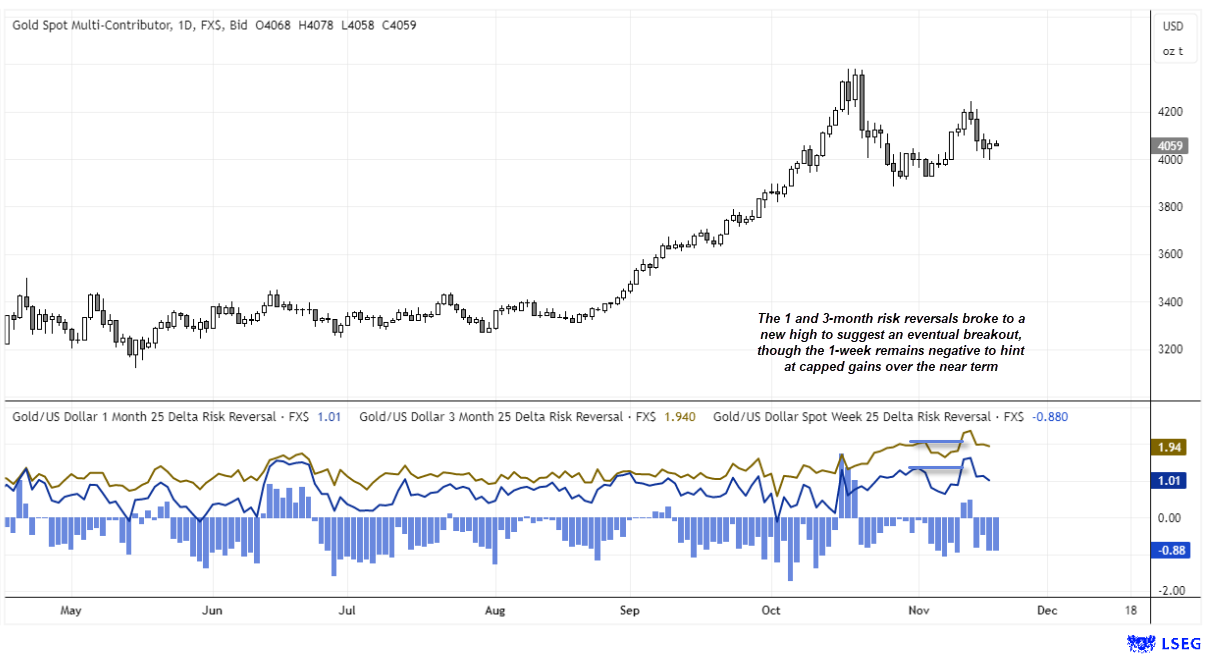
Chart analysis by Matt Simpson, Source: LSEG
Gold Futures Technical Outlook
The weekly chart hints we may have completed the first leg of a potential three-wave correction in gold. Prices held above 4000 last week, but the sizeable upper wick shows bulls surrendered much of their early gains. A short-term recovery is possible while Wave B develops, before a potential Wave C leg lower.
If Wave B were to stall near 4300, a symmetric move (Wave A = Wave C) would imply a downside target closer to 3800. For now, the focus is on the bullish setup forming on the daily chart.


Daily Signals Hint at Short-Term Rebound for Gold
The daily chart shows a second consecutive bullish hammer formed. While the daily RSI (2) is not oversold, it is close enough to consider a swing low is near, if not seen already.
A break above Tuesday’s high (4084) also clears the monthly pivot point and brings the 4200 handle and 4250 high into focus. A break above which opens up a run for 4300, near the monthly R1.
I can then reconsider the potential for a swing high to form around such resistance levels in anticipation of a move back down to 4000 and 3800.
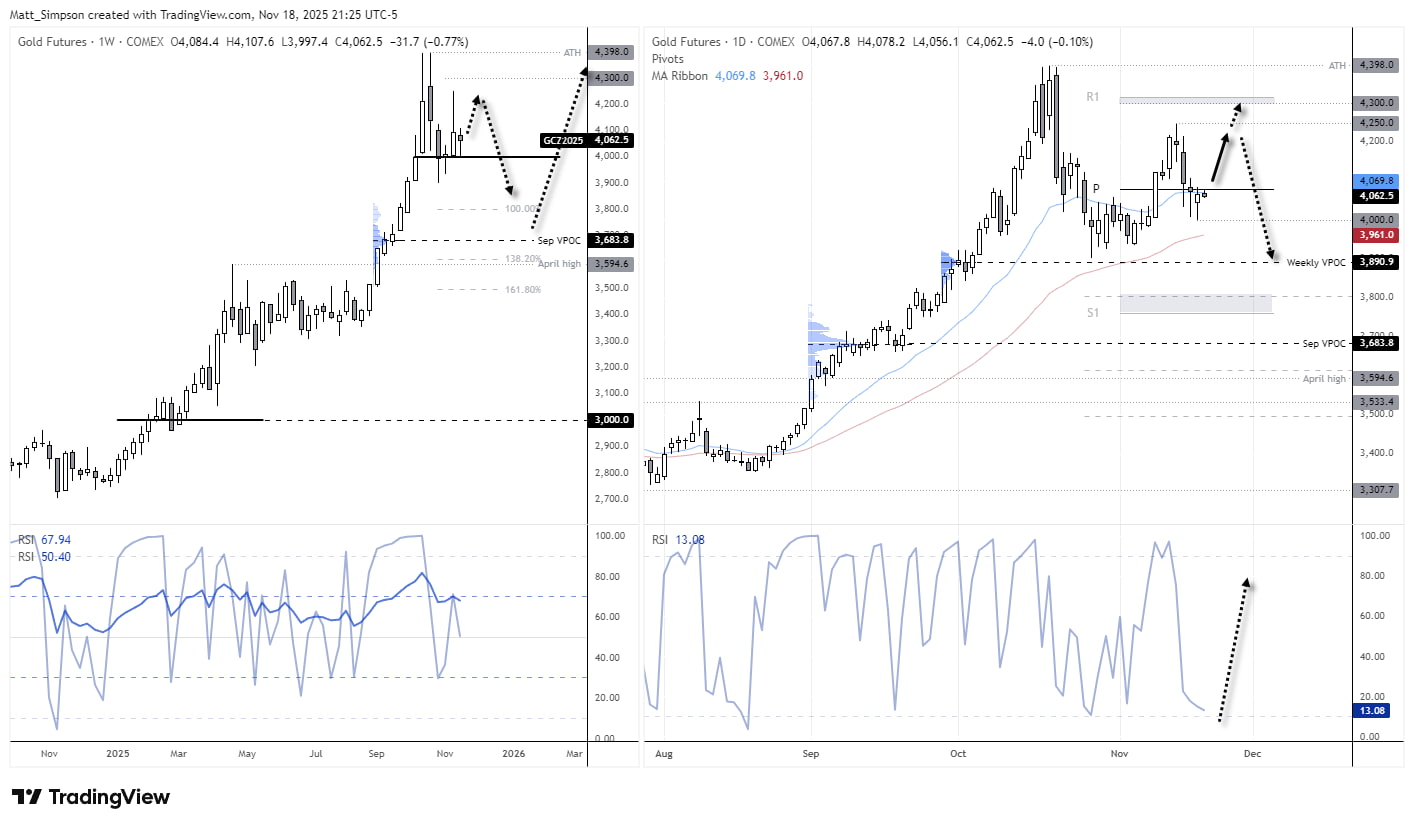
Chart analysis by Matt Simpson, Source: TradingView, COMEX Futures, Gold
View the full economic calendar
View the full economic calendar
-- Written by Matt Simpson
Follow Matt on Twitter @cLeverEdge
How to trade with City Index
You can trade with City Index by following these four easy steps:
- Open an account, or log in if you’re already a customer
• Open an account in the UK
• Open an account in Australia
• Open an account in Singapore
- Search for the market you want to trade in our award-winning platform
- Choose your position and size, and your stop and limit levels
- Place the trade
Related tags:
Latest market news




The complete CFD trading experience
Award-winning platforms, competitive spreads, low commissions and dedicated support.
We live and breathe the markets and are dedicated to helping traders realise their ambitions as we continue to set the industry bar.
Economic calendar
Web Trader platform
Our sophisticated web-based platform is packed with features.
Related articles
EUR/USD weekly outlook: FOMC and ECB to set the tone
The current backdrop is modestly bearish. On Friday, the EUR/USD closed modestly lower, down for the third consecutive day. The pair also posted a weekly decline after staging a modest recovery attempt in the previous week. Out of the past 8 weeks, the EUR/USD has fallen on 6 occasions. There is not much supporting factors for the single currency right now. So, the upside remains capped.

Gold Does Something it Hasn’t Done in a Year, is Larger Risk-Off Afoot?
With tech stocks getting hit harder last week there was collateral damage elsewhere, including gold as the metal closed below the $4k level for the week and that’s the first time that’s happened to spot gold in more than a year.


Silver forecast: metals liquidation drags XAG/USD into $50-55 support
Silver has broken its July low and slipped into a long-term support zone as the selling in precious metals deepens. The chart shows where the metal could bottom, and next week's Fed decision may decide whether it does.
StoneX Europe Ltd may make third party material available on this website which may contain information included but not limited to the conditions of financial markets. The material is for information purposes only and does not contain, and should not be construed as containing, investment advice and/or investment recommendation and/or an investment research and/or an offer of or solicitation for any transactions in financial instruments; any decision to enter into a specific transaction shall be made by the client following an assessment by him/her of their situation.
StoneX Europe Ltd makes no representation or warranty and assumes no liability as to the accuracy or completeness of the information provided, nor any loss arising from any investment based on a recommendation, forecast or other information supplied. You should always seek independent advice as to your suitability to speculate in any related markets and your ability to assume the associated risks, if you are at all unsure. We are not under any obligation to update any such material. Any opinion made may be personal to the author and may not reflect the opinion of StoneX Europe Ltd.