


Japanese yen price action setups: Oil surge revives USD/JPY, AUD/JPY upside risk
Energy supply fears have pushed crude sharply higher again, dragging the yen lower and putting fresh upside momentum behind USD/JPY and AUD/JPY.
Share this:

- Crude rebound renews yen pressure
- USD/JPY clears 159.30 resistance
- AUD/JPY tests triangle breakout risk
- Headlines on Hormuz remain key swing factor
Gulf tensions driving yen crosses
USD/JPY remains arguably the cleanest read on shifting sentiment towards the prospects for a lasting peace in the Middle East, with the incredibly tight linkage to US yields and yield spreads over the past week looking almost entirely explained by fluctuations in crude oil futures. Where they move, yields and spreads have tended to follow. The correlation matrix below, showing how closely USD/JPY has moved directionally with a range of macro and market variables over the past week, month and quarter, helps illustrate that point.

Source: TradingView
That view helps explain the overnight price action. Hopes for a quick resolution took another hit after Iran seized two ships in the Strait of Hormuz, tensions around the ceasefire remained unresolved, and there was little sign of meaningful progress on broader negotiations. With the waterway still heavily disrupted, crude oil prices surged again as markets repriced supply risks.
It’s also worthwhile noting that USD/JPY continues to trade more like a risk asset than a haven, reflecting its standing as a major funding currency for carry trades. The pair continues to exhibit reasonably tight positive correlations with implied volatility measures tracking future movements in US stocks and bonds, along with a persistent negative correlation with risk assets such as S&P 500 futures, even with the latter now trading at record highs.
Reading the relationships
For USD/JPY, it means energy markets likely matter more than economic data, technical factors, or even broader risk appetite right now. Higher crude prices can lift inflation expectations and Treasury yields while simultaneously undermining the yen through Japan’s heavy reliance on imported energy. That combination helps explain why the pair remains supported, with oil continuing to act as the key swing factor for direction.
USD/JPY eyes 160
Source: TradingView
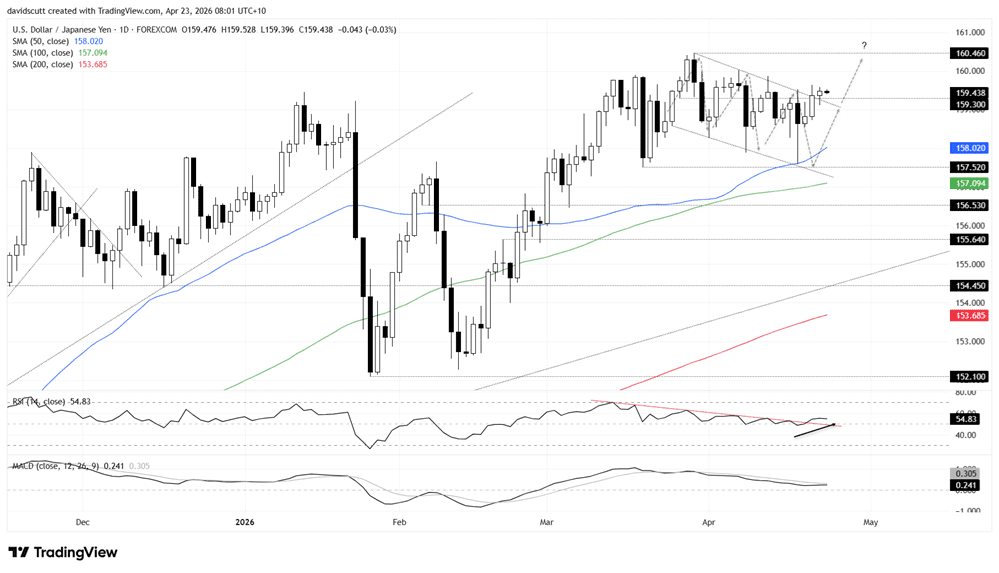
USD/JPY has broken out of the gradual descending channel it had traded within for over a month on the topside, seeing the price climb above 159.30 resistance that had thwarted bullish moves over the past week. It may now flip to offering support, providing a level to build long setups around, allowing for entry above with a tight stop beneath, targeting the psychologically important 160 level initially and the March 30 high of 160.46 after that.
Like the price, RSI (14) has broken the downtrend it had been sitting in since early March, pushing gradually away from the neutral 50 level. MACD also remains in positive territory despite crossing the signal line from above earlier this month, providing a largely neutral backdrop in terms of messaging on directional risks, with a slight edge to the bulls.
However, with the pair operating in a headline-driven market regime, the risk of renewed downside cannot be ruled out should crude prices lurch lower again, meaning short setups should not be dismissed from the equation. If USD/JPY were to reverse lower and hold beneath 159.30, it would allow for shorts to be set with a tight stop above, targeting the 50-day moving average that sits just above 158, a level that has attracted bids on the last two occasions it was tested.
Triangle pressure builds
Source: TradingView
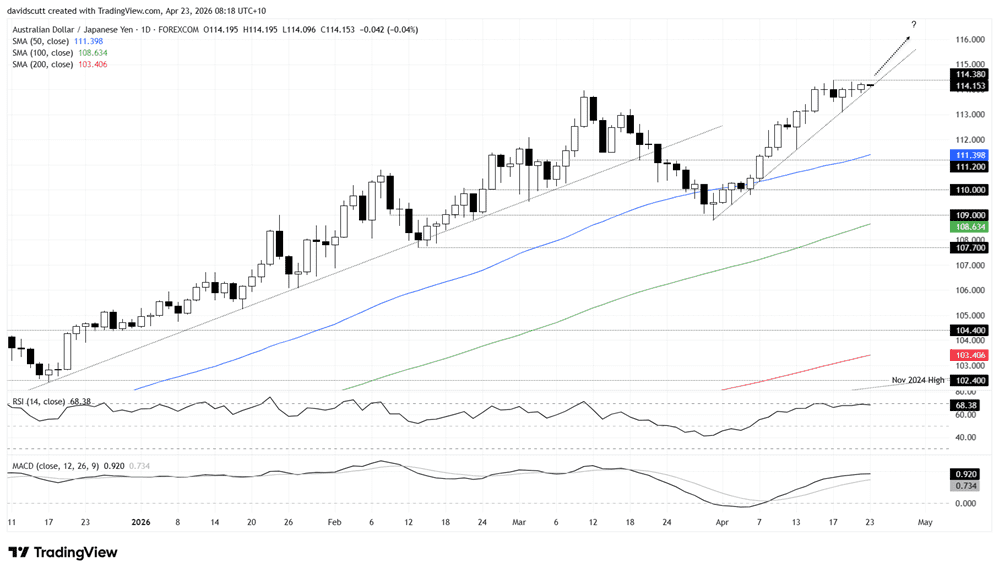
AUD/JPY is another yen cross worth watching today when it comes to potential trade setups, with the price wedged against uptrend support dating back to the lows set in late March while being capped beneath the April 17 high of 114.38. The structure therefore resembles an ascending triangle, pointing to the risk of an eventual bullish breakout and fresh highs for the pair. Given its current location, though, if that is going to happen, today may have to be the day.
Longs could be set on a break above 114.38 with a tight stop beneath, with the view of waiting for notable reversal signals when considering when to cut the trade rather than nominating a specific extension target.
But if the price cannot break 114.38 and trades beneath the late March uptrend, it would allow for shorts to be set with a tight stop above 114.38 for protection. 113.10, where the pair bottomed on April 20, looms as an initial target, with the confluence of the 50-day moving average and 111.20 support the next level after that.
Both RSI (14) and MACD continue to signal sustained upside pressure, even if it is no longer building at this stage. That favours a bullish directional bias overall.
Latest market news




The complete CFD trading experience
Award-winning platforms, competitive spreads, low commissions and dedicated support.
We live and breathe the markets and are dedicated to helping traders realise their ambitions as we continue to set the industry bar.
Economic calendar
Web Trader platform
Our sophisticated web-based platform is packed with features.
Related articles
AUD/USD hammered by US yields and fading RBA hike bets
US yields, dollar strength and fading RBA hike bets have combined to drive AUD/USD to fresh multi-month lows. The macro and technical bias remains bearish, although history suggests parts of the move are now reaching unusually stretched levels.
EUR/USD Forecast: Euro Struggles to Find Support Even After U.S. PCE Data
The euro continues to face a challenging environment in the short term. The currency has struggled to regain ground against a U.S. dollar that remains firmly supported, a dynamic reflected in EUR/USD, which has now recorded three consecutive losing sessions and a decline of roughly 0.6%.

Canadian Dollar Forecast: USD/CAD Four-Week Rally Eyes Yearly Highs 9 30 2026
USD/CAD has advanced in 14 of the past 15 sessions, but stretched momentum raises the stakes as major resistance and NFP come into focus.

StoneX Europe Ltd may make third party material available on this website which may contain information included but not limited to the conditions of financial markets. The material is for information purposes only and does not contain, and should not be construed as containing, investment advice and/or investment recommendation and/or an investment research and/or an offer of or solicitation for any transactions in financial instruments; any decision to enter into a specific transaction shall be made by the client following an assessment by him/her of their situation.
StoneX Europe Ltd makes no representation or warranty and assumes no liability as to the accuracy or completeness of the information provided, nor any loss arising from any investment based on a recommendation, forecast or other information supplied. You should always seek independent advice as to your suitability to speculate in any related markets and your ability to assume the associated risks, if you are at all unsure. We are not under any obligation to update any such material. Any opinion made may be personal to the author and may not reflect the opinion of StoneX Europe Ltd.