







Nasdaq 100 Breaks Out Into Bull Market, Tops Wall Street Rally
Nasdaq 100 futures erased a 75-day bear market in just 23 sessions. Is this the start of a new bullish cycle—or just another bear market bounce?
Share this:

View related analysis:
- USD/JPY, USD/CAD, AUD/USD Outlook: US Dollar Rallies on Tariff Pause
- ASX 200 Slips Amid Cautious Sentiment Ahead of Key US Data
- AUD/USD, Nasdaq Soar as Trump Blinks First, Sparking Epic Market U-Turn
- ASX 200 Hang Seng Analysis: Bears Shaken Out From Wall Street Surge
View related analysis:
- USD/JPY, USD/CAD, AUD/USD Outlook: US Dollar Rallies on Tariff Pause
- ASX 200 Slips Amid Cautious Sentiment Ahead of Key US Data
- AUD/USD, Nasdaq Soar as Trump Blinks First, Sparking Epic Market U-Turn
- ASX 200 Hang Seng Analysis: Bears Shaken Out From Wall Street Surge
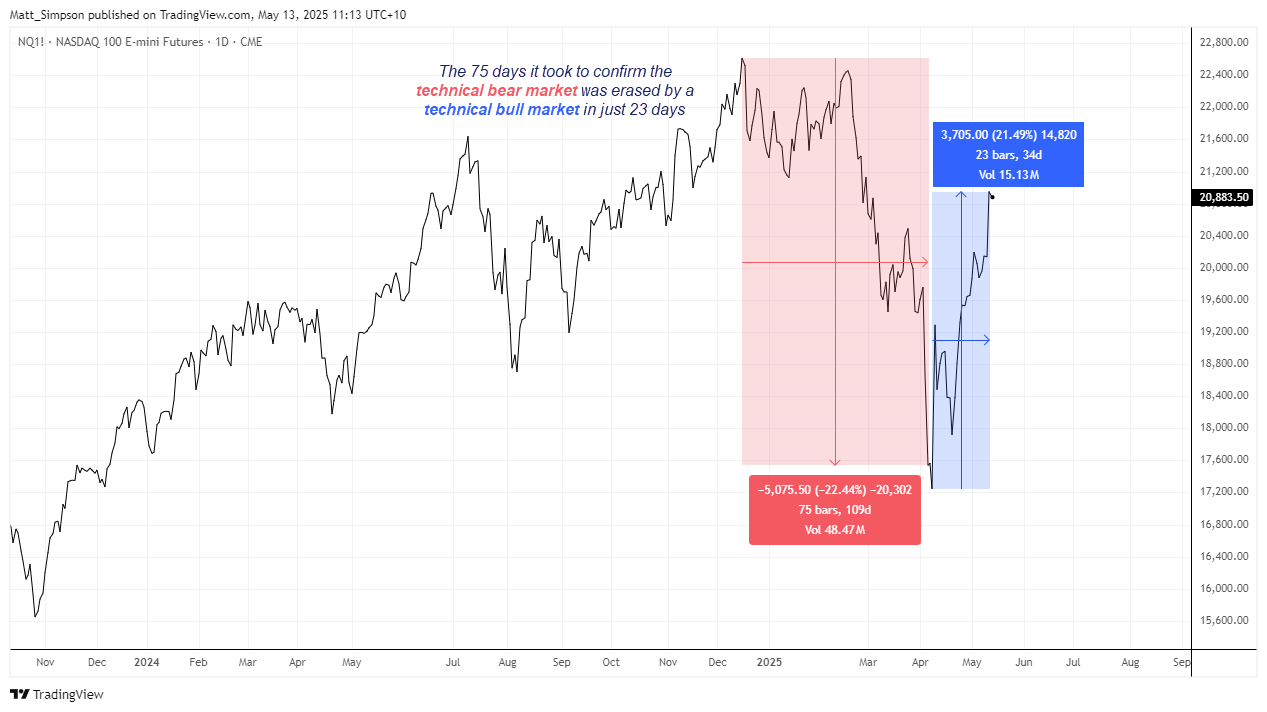
Using the daily close chart, the Nasdaq 100 futures market set its most recent record high on Monday, 16 December 2024. It wasn’t until late February that bearish momentum truly took hold, but by 4 April the Nasdaq had confirmed a technical bear market—defined as a 20% decline from the recent high on a closing basis. That marked a span of 75 trading days between its peak and bear market confirmation. Remarkably, that entire bear market has now been erased in just 23 trading days.
If Nasdaq bulls can unwind a bear market in a third of the time it took to form, perhaps the cycle low is already in place.
On the flip side, many a market veteran might be quick to point out that bear market bounces—and volatile rallies within a broader downtrend—have a habit of sucker-punching bulls into believing the worst is over, only for momentum to reverse lower once again. That said, with Trump’s trade war quickly winding down, I see a reasonable case for the Nasdaq and its Wall Street peers to reach new record highs before any fresh tests of cycle lows.
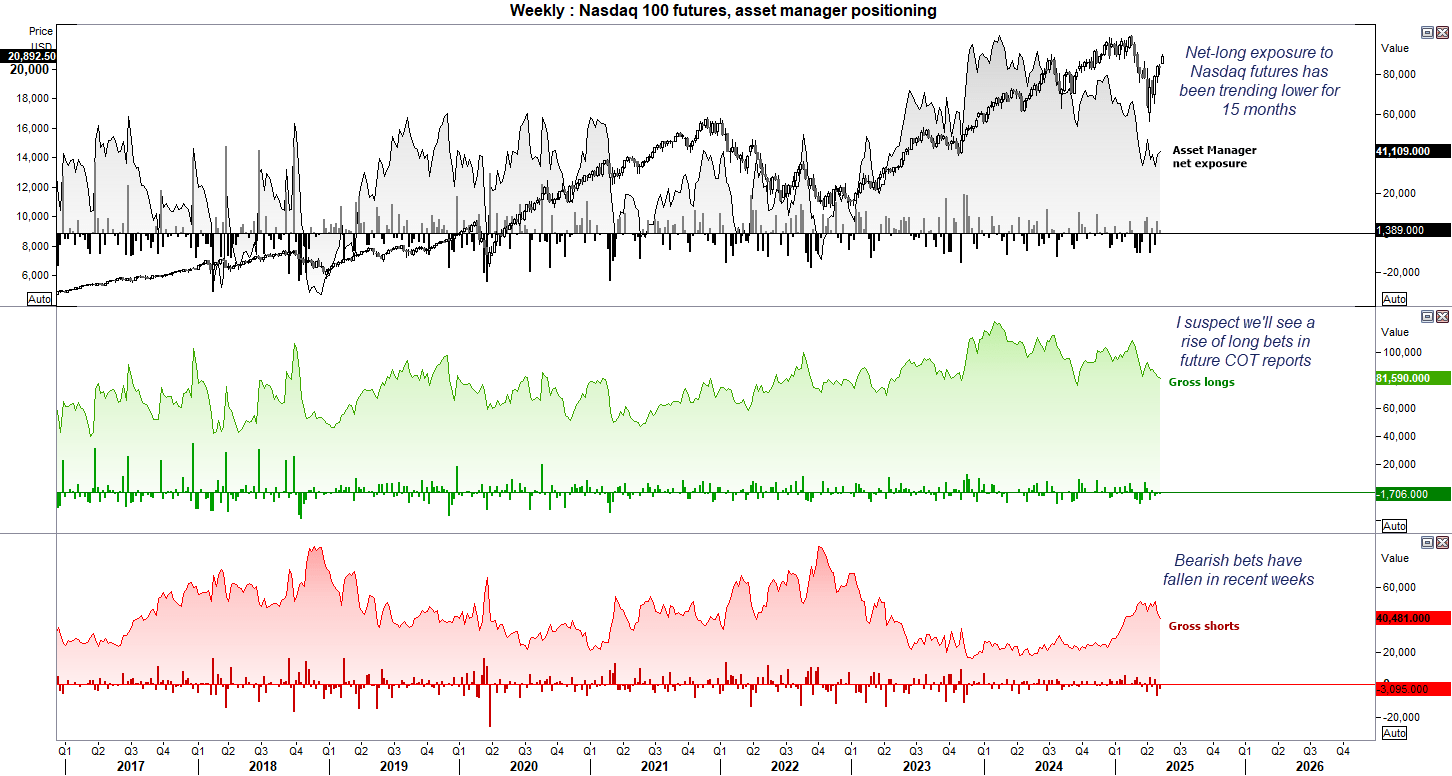
Nasdaq 100 Futures Positioning (NQ): Weekly COT Report Analysis
With Nasdaq futures ripping higher on positive trade headlines, the case builds for asset managers to get behind the bullish move. Net-long exposure has been trending lower for the past 15 months but has stabilised around 35,000 contracts in recent weeks. Gross shorts have also diminished, signalling a lack of conviction to bet against the tech sector. I believe asset managers may now be tempted to rejoin the party.
Nasdaq 100 Futures Technical Analysis: US Tech Index Outlook
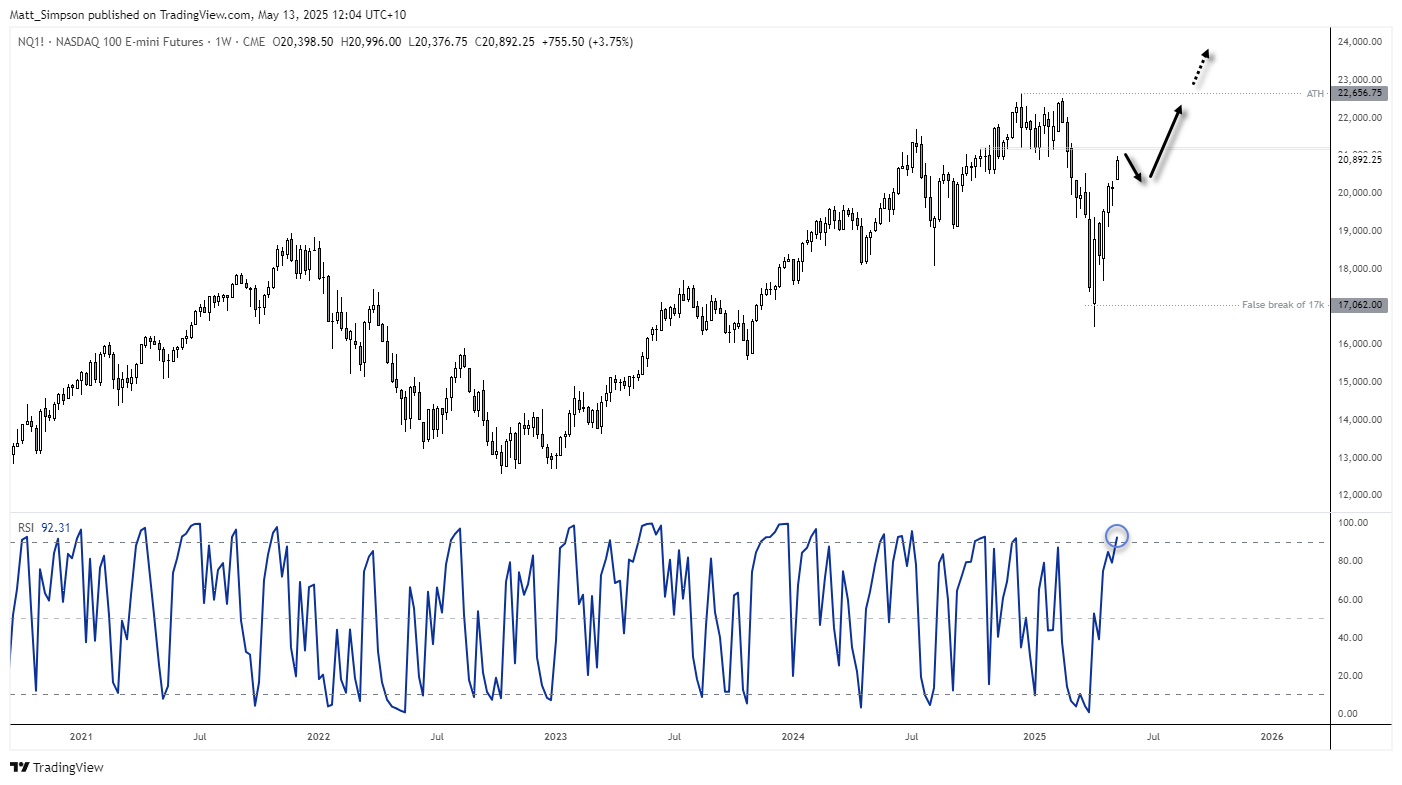
The low-to-high range of the Nasdaq is now 27% from the April low and the weekly RSI (2) has moved into the overbought level. However, with 21k and a support cluster ~21,200 nearby, perhaps we are nearing the end of this initial bounce. While I favour a break to a new high in the coming weeks or months, the preference is to seek dips and not chase the move. 20k seems like an obvious support level on this timeframe, should it be allowed to retrace this far.
Nasdaq 100 Futures Technical Analysis: Daily Chart
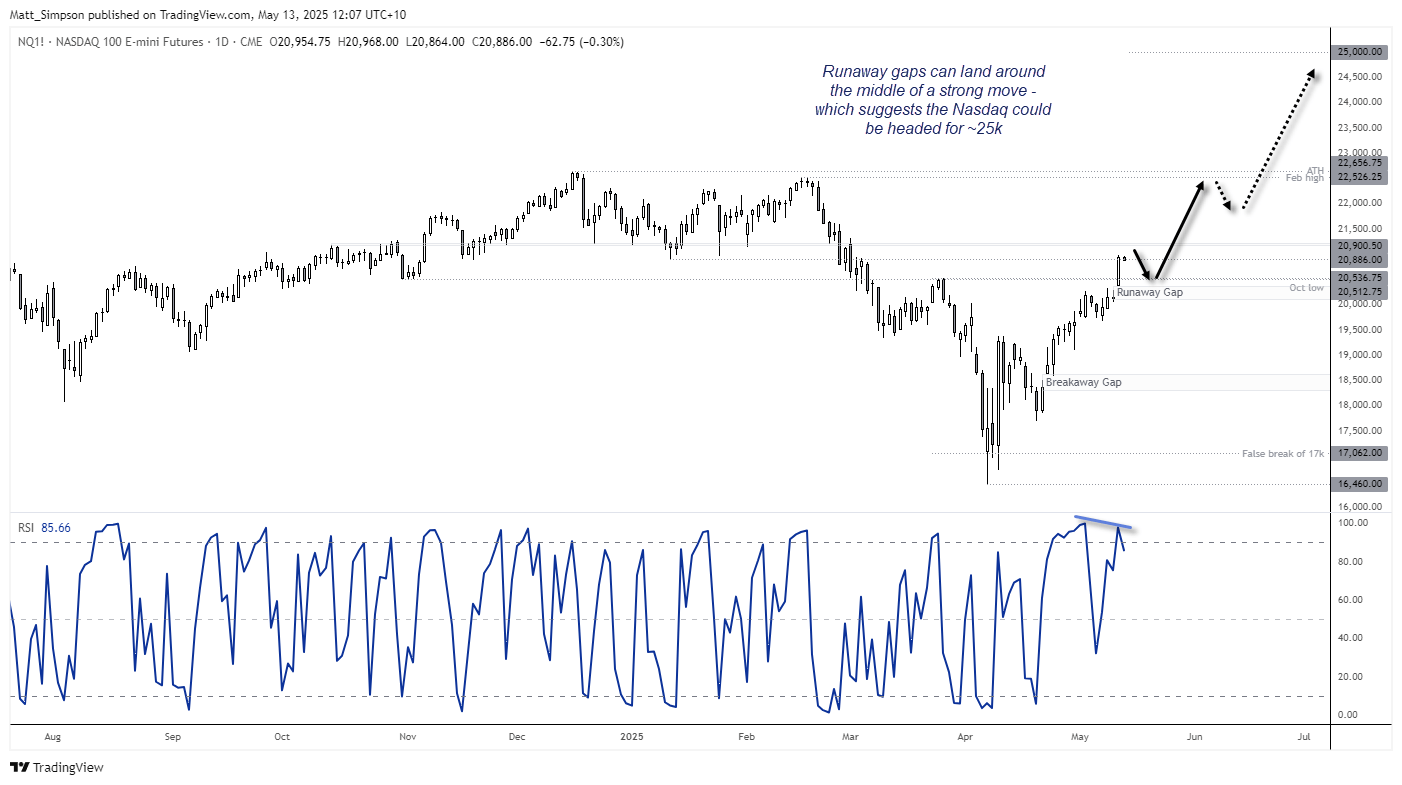
The daily chart shows an upside gap, its second such move since the April low. The breakaway gap on April 22 marks the required shift in sentiment, back when traders were still expecting the Nasdaq to trend lower. That means Monday’s gap could be the runaway gap – typically found around the middle of a trending move. If so, it implies the Nasdaq could be headed for 25k.
Take note of the bearish divergence on the daily RSI (2) to warn of potential weakness. Though I expect any pullback to be shallow given the runaway gap and strong bullish candle on Monday.
-- Written by Matt Simpson
Follow Matt on Twitter @cLeverEdge
How to trade with City Index
You can trade with City Index by following these four easy steps:
- Open an account, or log in if you’re already a customer
• Open an account in the UK
• Open an account in Australia
• Open an account in Singapore
- Search for the market you want to trade in our award-winning platform
- Choose your position and size, and your stop and limit levels
- Place the trade
Related tags:
Latest market news




The complete CFD trading experience
Award-winning platforms, competitive spreads, low commissions and dedicated support.
We live and breathe the markets and are dedicated to helping traders realise their ambitions as we continue to set the industry bar.
Economic calendar
Web Trader platform
Our sophisticated web-based platform is packed with features.
Related articles
EUR/USD weekly outlook: FOMC and ECB to set the tone
The current backdrop is modestly bearish. On Friday, the EUR/USD closed modestly lower, down for the third consecutive day. The pair also posted a weekly decline after staging a modest recovery attempt in the previous week. Out of the past 8 weeks, the EUR/USD has fallen on 6 occasions. There is not much supporting factors for the single currency right now. So, the upside remains capped.

S&P 500, Nasdaq, Dow Forecast: Nasdaq Selloff Deepens as Dow Rally Stalls 10 24 2026
A failed S&P breakout and looming Nasdaq support test raise the stakes for next week’s Fed decision and October’s monthly close.


Silver forecast: metals liquidation drags XAG/USD into $50-55 support
Silver has broken its July low and slipped into a long-term support zone as the selling in precious metals deepens. The chart shows where the metal could bottom, and next week's Fed decision may decide whether it does.
StoneX Europe Ltd may make third party material available on this website which may contain information included but not limited to the conditions of financial markets. The material is for information purposes only and does not contain, and should not be construed as containing, investment advice and/or investment recommendation and/or an investment research and/or an offer of or solicitation for any transactions in financial instruments; any decision to enter into a specific transaction shall be made by the client following an assessment by him/her of their situation.
StoneX Europe Ltd makes no representation or warranty and assumes no liability as to the accuracy or completeness of the information provided, nor any loss arising from any investment based on a recommendation, forecast or other information supplied. You should always seek independent advice as to your suitability to speculate in any related markets and your ability to assume the associated risks, if you are at all unsure. We are not under any obligation to update any such material. Any opinion made may be personal to the author and may not reflect the opinion of StoneX Europe Ltd.