




Nasdaq 100 – Dow Ratio: Focus on Concentration Rather than Timing Risk Trends - Top Trade of 2025
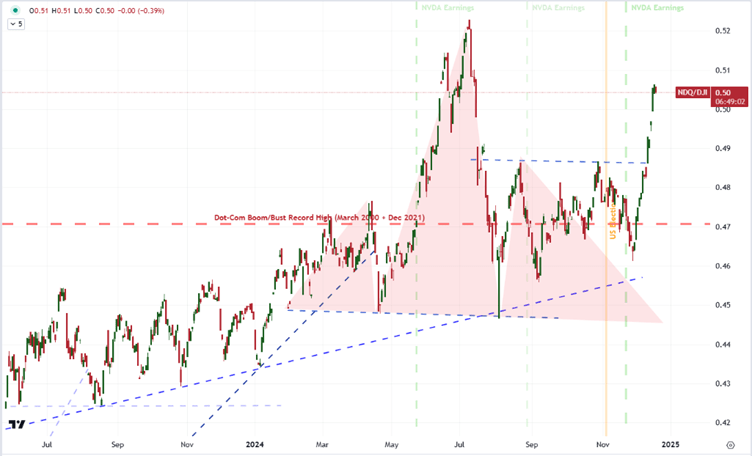
Over the past year, the concentration into top market cap stocks – which aligns to tech – has pushed the Nasdaq 100 to Dow ratio well above the Dot-com peak
Share this:

Talking Points:
- Timing is hard enough in navigating markets, but to assess market trends while prevailing fundamental winds are inconsistent makes probabilities even thinner
- While it can grow extreme, there tends to be a ‘balance’ in speculative preferences and exposure – similar to activity levels
- Over the past year, the concentration into top market cap stocks – which aligns to tech – has pushed the Nasdaq 100 to Dow ratio well above the Dot-com peak
Engaging markets is always a factor of navigating probabilities. There is no certainty in trading or investing – no matter how much we trust our process, the charts or even policymakers – so it is our job to evaluate the likelihood of developments; and determine whether a view has surpassed our personal risk tolerance as something to actively pursue.
There is nothing more fundamental in the bigger picture of fundamentals in my view than ‘risk trends’ as it can dictate the under currents of virtually every market and asset in the system. However, getting a clear gauge on sentiment seems challenging. There is an unmistakable persistence in speculative reach as benchmarks like the S&P 500 hit record highs, but the din of questioning its value and persistence are as loud as the headlines applauding the new bullish milestones.
Over different times this past year, it seems that a different engine was directing sentiment: softer inflation expectations, forecasts of central bank easing, improved growth forecasts, a change in political leadership, etc. Through these phases, correlations of indices and headlines tightened; but they would eventually fade – and often without much heads up. I think it is better to avoid trying to time the direction and tempo of broader risk trends (but do be aware if/when that transition occurs) and look instead to where there are exaggerated concentrations. That said, there is nowhere more intense than the ratio between Nasdaq 100 to the Dow Jones Industrial Average.
Chart of the Nasdaq 100 to Dow Jones Industrial Average Ratio (Daily)
Source: TradingView, John Kicklighter
Sentiment permeates all markets – whether on the micro level of the individual asset or macro as a reflecting of the broader financial system. My preferred representative of the whole market is equities given its ubiquity in the most portfolios (particularly in individual and representative fund accounts), which is further concentrated into the major US indices. Within this indicative ecosystem, the Nasdaq 100 has taken on the lead of the multi-year technology drive which was further intensified through this past year’s AI surge.
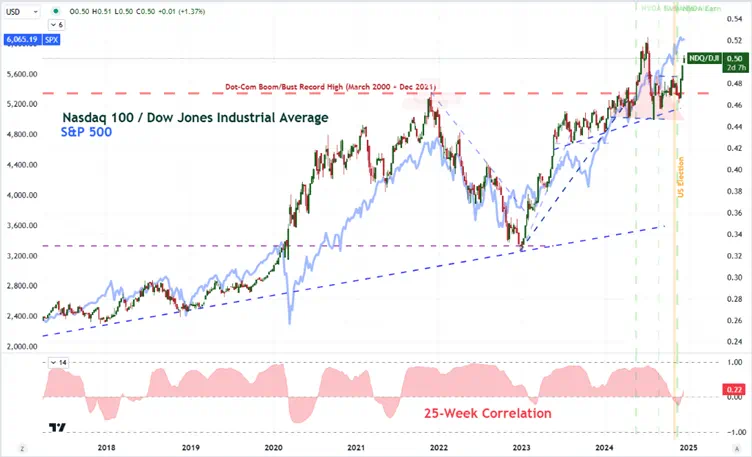
There is no telling how long the goldilocks of risk appetite between growth and monetary policy conditions can be maintained; but given the concentration in the top market cap names and tech tickers in particular, circumstances look particularly stretched. To focus more on the intensity of exposure rather than ‘risk trends’ themselves, I like to look at the Nasdaq 100 relative to another index with a different systemic makeup. The Dow Jones Industrial Average is a ‘blue chip’ oriented value index that is more balanced in terms of industry. And yet, the ratio of the Nasdaq to Dow has soared through the peak of the Dot-com boom back in March of 2000.
Chart of the Nasdaq 100 to Dow Ratio Overlaid with S&P 500 and 25-Week Correlation (Weekly)
Source: TradingView, John Kicklighter
It is hard to miss the disparity in performance between the two indices when we look at the historical chart of their ratio. The rise of AI – so well incapsulated by the more than 210 percent, peak-to-trough surge of NVDA through the year – can add another to factor to the relative shift of capital to this corner of the market. However, the transformative appeal of that segment may already be pushing its limits.
While a regulatory change that supercharges artificial intelligence in the US could prove an outlier amplifier, sentiment is more likely to take one of two paths. One scenario is risk either levels out or persists, whereby capital will more likely be diversified looking for ‘value’. Alternatively, a collapse in sentiment would likely render the concentration a distinct liability – as was the case in 2022.
Chart of the Nasdaq 100 to Dow Jones Industrial Average Ratio with VIX Volatility Index and 6-Month Correlation (Monthly)
Source: TradingView, John Kicklighter
In projecting how quickly and intensively the market is likely to rebalance across the risk spectrum, the catalyst and market backdrop play key factors. There was a bout of high volatility through August this last year, which was very acute but short-lived. Setting aside that brief period, the general volatility environment has been more akin to the period through 2017. Should activity conditions normalize under emerging fundamental issues, a correction like that seen this past August could turn into something more significant like what was experienced through 2022. Should the Nasdaq-Dow ratio drop beneath 0.35, something more systemic is likely to be afoot with sentiment undergoing a genuine sea change.
-- Written by John Kicklighter, Global Head of Content
Related tags:
Latest market news




The complete CFD trading experience
Award-winning platforms, competitive spreads, low commissions and dedicated support.
We live and breathe the markets and are dedicated to helping traders realise their ambitions as we continue to set the industry bar.
Economic calendar
Web Trader platform
Our sophisticated web-based platform is packed with features.
Related articles

S&P 500 forecast: AI linked stocks remain under pressure
And just like that, it is Friday again and the end of a volatile week. Today offers little on the macro calendar to change the prevailing narrative, leaving markets largely at the mercy of risk appetite, oil prices and the growing unease around the AI trade.


Nasdaq 100 Slides as Meta Posts Strong Results and Drops 6%
The Nasdaq 100 sell-off is being driven by doubts over AI spending, as investors punish strong earnings that fail to justify stretched valuations.

USD/JPY, Nikkei Break Lower as AI Meltdown Spreads
Thursday’s tech tantrum has become Friday’s fire sale. With Nikkei support giving way and the yen strengthening, could the selling start feeding on itself?
StoneX Europe Ltd may make third party material available on this website which may contain information included but not limited to the conditions of financial markets. The material is for information purposes only and does not contain, and should not be construed as containing, investment advice and/or investment recommendation and/or an investment research and/or an offer of or solicitation for any transactions in financial instruments; any decision to enter into a specific transaction shall be made by the client following an assessment by him/her of their situation.
StoneX Europe Ltd makes no representation or warranty and assumes no liability as to the accuracy or completeness of the information provided, nor any loss arising from any investment based on a recommendation, forecast or other information supplied. You should always seek independent advice as to your suitability to speculate in any related markets and your ability to assume the associated risks, if you are at all unsure. We are not under any obligation to update any such material. Any opinion made may be personal to the author and may not reflect the opinion of StoneX Europe Ltd.