






Nasdaq 100 Forecast: Asset Managers Ramp Up Bearish Tech Bets
While the past four weeks of bearish price action on Wall Street has surprised some, asset managers have raising their bets against Nasdaq 100 futures since January.
Share this:
Concerns surrounding Trump’s tariffs have continued to weigh on sentiment this week, with Wall Street indices currently on track for a fourth week lower. His threat of raising Canda’s tariffs to 50% from 25% on steel and aluminium provide further evidence that he more than happy to send the stock market lower, which much unlike his first term. Treasury Secretary Scott Bessent has already warned traders that there is no “Trump put”, and they are finally taking notices.
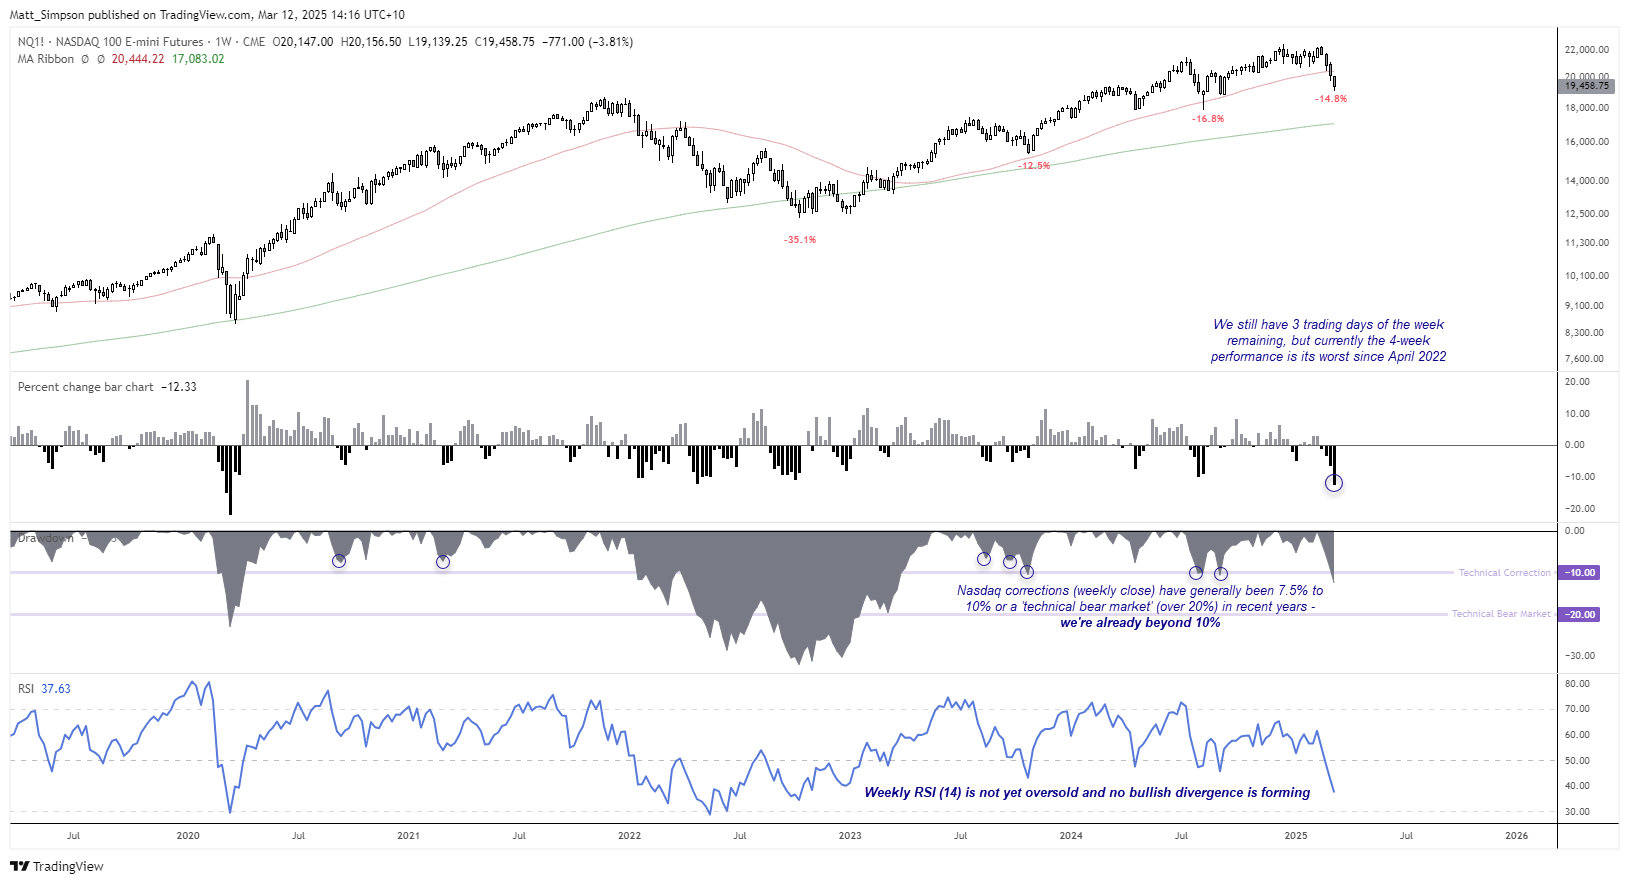
As things stand, Nasdaq 100 futures are amid their worst 4-week run since April 2022, with a high-to -low range of -12.3%. This places it comfortably within the ‘technical correction’ bracket, defined as a -10% move from a close high. These metrics alone make me favour a bounce for the Nasdaq 100 over the near term, although further out I suspect new lows await. And that a move back to a record high could be way off.
Previous corrections have generally fallen within the 7.5% - 10% range on a closing basis, so the fact that it currently sits at -12.3% suggests it could be a deeper correction or a technical bear market (defined as a -20% move). Further, the weekly RSI (14) is not yet oversold and is confirming the move lower, which leaves plenty more downside for prices. Moreover, asset managers have been shying away from longs and ramping up shorts in recent weeks.
Nasdaq 100 futures (NQ) positioning – COT report
Being long Nasdaq was all the rage last year, although asset managers were slowly reducing their net-long exposure from February 2024. However, they have really ramped up their bets against it this year, with gross-short exposure reaching a 1-year high. While gross longs remain elevated, they have been trimmed the past two weeks. And if we see the closure of longs pick up pace, chances are we’re in for a much deeper correction for the Nasdaq and risk in general.
Nasdaq 100 technical analysis:
The decline from the Nasdaq’s February high has effectively been in one straight line. Not even the 200-day SMA prompted much of a bounce before its losses resumed. Volumes were rising during the decline towards and below the 200-day SMA to show bearish initiation as opposed to longs simply covering.
However, a Doji found support around the 19,226 VPOC (volume point of control) on Tuesday and bullish divergences are forming on the daily RSI (2) and RSI (14) so suggest a bounce could be due over the near term, but with trade headlines dominating sentiment we should also be on guard for a move down to the 19k handle or 18,869 swing low, near the 78.6% Fibonacci level.
For risk to truly bounce likely requires a reversal of Trump’s tariffs, and that semes unlikely. Bu should he loosen his grip on Canada’s eye-watering tariffs, perhaps we could see a move back towards 20k. But I suspect bears are waiting to reload into any such bounce, and a move to 18k near the April / August 2024 lows seem likely.
-- Written by Matt Simpson
Follow Matt on Twitter @cLeverEdge
How to trade with City Index
You can trade with City Index by following these four easy steps:
- Open an account, or log in if you’re already a customer
• Open an account in the UK
• Open an account in Australia
• Open an account in Singapore
- Search for the market you want to trade in our award-winning platform
- Choose your position and size, and your stop and limit levels
- Place the trade
Related tags:
Latest market news




The complete CFD trading experience
Award-winning platforms, competitive spreads, low commissions and dedicated support.
We live and breathe the markets and are dedicated to helping traders realise their ambitions as we continue to set the industry bar.
Economic calendar
Web Trader platform
Our sophisticated web-based platform is packed with features.
Related articles
EUR/USD weekly outlook: FOMC and ECB to set the tone
The current backdrop is modestly bearish. On Friday, the EUR/USD closed modestly lower, down for the third consecutive day. The pair also posted a weekly decline after staging a modest recovery attempt in the previous week. Out of the past 8 weeks, the EUR/USD has fallen on 6 occasions. There is not much supporting factors for the single currency right now. So, the upside remains capped.

S&P 500, Nasdaq, Dow Forecast: Nasdaq Selloff Deepens as Dow Rally Stalls 10 24 2026
A failed S&P breakout and looming Nasdaq support test raise the stakes for next week’s Fed decision and October’s monthly close.


Silver forecast: metals liquidation drags XAG/USD into $50-55 support
Silver has broken its July low and slipped into a long-term support zone as the selling in precious metals deepens. The chart shows where the metal could bottom, and next week's Fed decision may decide whether it does.
StoneX Europe Ltd may make third party material available on this website which may contain information included but not limited to the conditions of financial markets. The material is for information purposes only and does not contain, and should not be construed as containing, investment advice and/or investment recommendation and/or an investment research and/or an offer of or solicitation for any transactions in financial instruments; any decision to enter into a specific transaction shall be made by the client following an assessment by him/her of their situation.
StoneX Europe Ltd makes no representation or warranty and assumes no liability as to the accuracy or completeness of the information provided, nor any loss arising from any investment based on a recommendation, forecast or other information supplied. You should always seek independent advice as to your suitability to speculate in any related markets and your ability to assume the associated risks, if you are at all unsure. We are not under any obligation to update any such material. Any opinion made may be personal to the author and may not reflect the opinion of StoneX Europe Ltd.