





Nasdaq 100 forecast: Stocks slip as tariff relief rally fizzles
Markets are catching their breath after Wednesday’s dramatic rebound, but Thursday’s early action suggests the euphoria was short-lived. At the time of writing in mid-day London trade, Nasdaq 100 futures were down nearly 2.5%, with similar performance observed across global indices.
Share this:

Markets are catching their breath after Wednesday’s dramatic rebound, but Thursday’s early action suggests the euphoria was short-lived. At the time of writing in mid-day London trade, Nasdaq 100 futures were down nearly 2.5%, with similar performance observed across global indices. The renewed weakness came as investors wondered what the true impact of Trump’s tariff shuffle might be and figured it may be prudent to hit the pause button while the trade war between the US and China continues. That being said, dip-buyers will be lurking for opportunities after the big reversal yesterday, and we could still seem some decent bounce trades here and there while the market finds a new equilibrium price. The trend is still technically bearish given the lower highs, and for that reason, the bulls should not get complacent and still trade from level to level until more evidence of a market bottom emerges. Thus, the Nasdaq 100 forecast is yet to turn decidedly bullish.
So why are markets weakening again?
Yesterday sharp rally was driven mainly by relief. Yes, there is a pause on those reciprocal levies for 90 days, but the 10% universal rate is still there. What’s more, tariffs on Chinese imports are now at a staggering 125%. China, in turn, is weighing its next move, with top officials expected to meet Thursday to discuss fresh stimulus. For now, though, the US-China trade uncertainty is holding back excessive risk-taking, while it also remains unclear what sort of trade deals, if any, the US will strike with its other large trading partners, including the European Union. Speaking of the EU, it has just decided to put counter-tariffs on hold for 90 days. While the pause on both sides suggest trade deals could be struck, nothing is guaranteed and negotiations could take a long time, and any deals may have to get approval of the EU parliament etc., which adds further complexity to the situation. And then the is the trade feud between the US and China, which could drag on for a while.
It is also worth pointing out that the record-breaking rally midweek was more a function of poor liquidity and frantic short covering than actual buying. While dip-buying is something that could emerge in the days ahead, as indices test broken resistance levels, it is possible that traders may put more pressure on Trump by selling bonds again and lift yields to uncomfortable levels. So, don’t be surprised if traders quickly back off those risk-on moves.
The fact that oil (-3%) and the dollar are both sliding again shows worries about global growth — especially China’s — are gnawing away at demand expectations. Safe haven currencies like the Japanese yen and Swiss franc are catching a bid, which is not a great sign for risk.
Technical Nasdaq 100 forecast: Key levels to watch
Source: TradingView.com
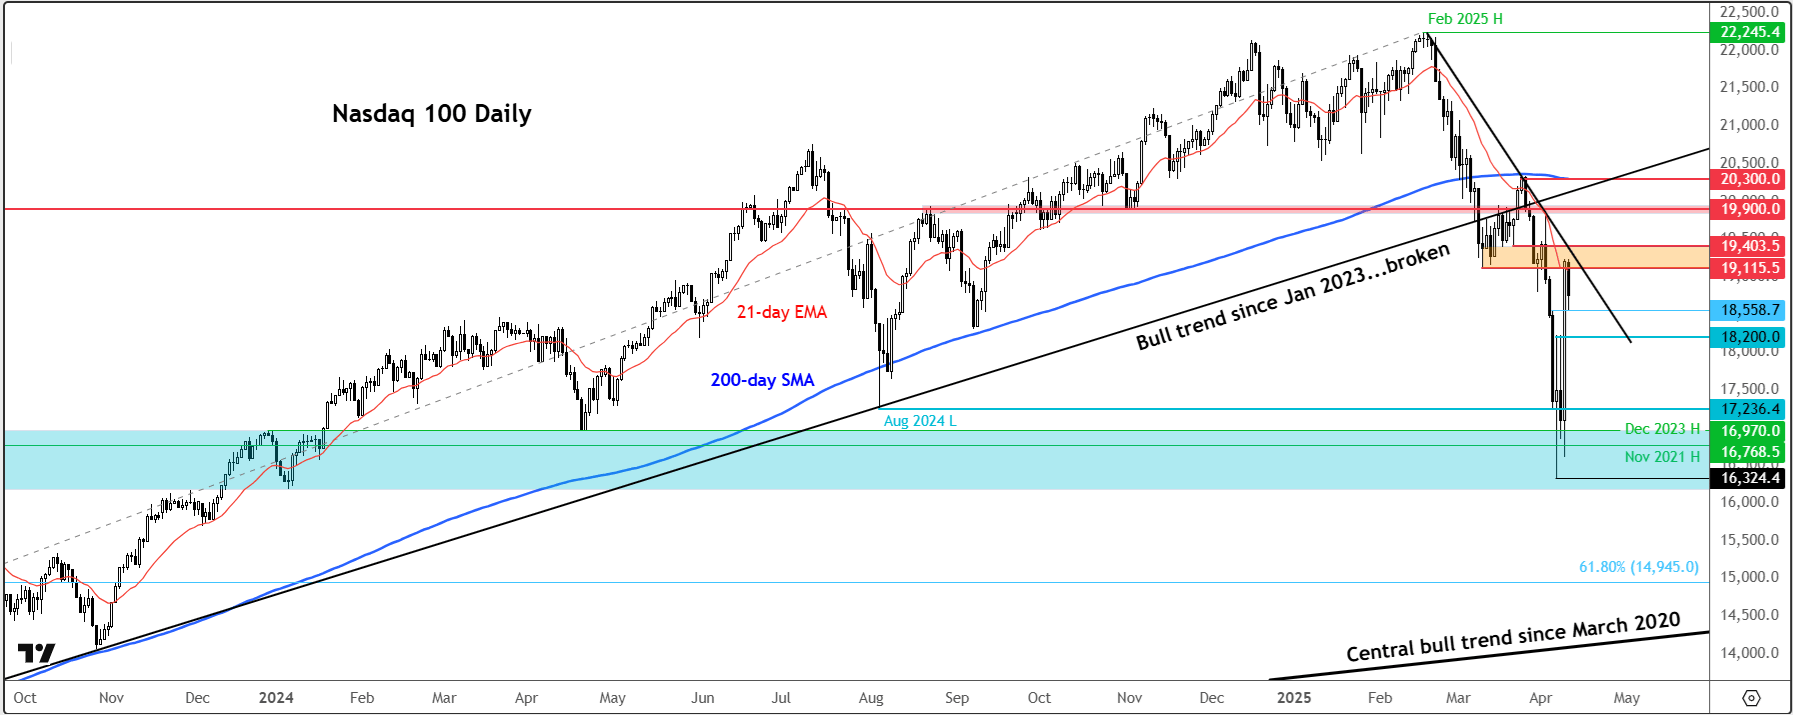
The V-shaped rebound off a long-term support area (16300-16970) is always a great technical sign, but we need to see interim higher highs before giving the all-clear that the trend has turned bullish again.
Right now, the Nasdaq 100 has stopped right at resistance in the range between 19100 to 19400. This area was prior support and where the 21-day exponential average is coming into play. Above here, the next big resistance is seen around 19,900, followed by the underside of the broken trend line at 20,000, and then the 200-day average slightly higher at 20300.
A few support levels to watch include 18,560, marking today’s earlier low. Below this, 18,200 is the next key level to watch. Below that, the point of origin of yesterday’s breakout at 17465. The August 2024 low, now reclaimed, comes in at 17,235.
The bottom line is that the tariff narrative still remains too volatile for comfort, and markets are searching for equilibrium in a sea of uncertainty. Against this backdrop, market volatility is here to stay for a while, keeping the Nasdaq 100 forecast far from certain.
-- Written by Fawad Razaqzada, Market Analyst
Follow Fawad on Twitter @Trader_F_R
How to trade with City Index
You can trade with City Index by following these four easy steps:
- Open an account, or log in if you’re already a customer
• Open an account in the UK
• Open an account in Australia
• Open an account in Singapore
- Search for the company you want to trade in our award-winning platform
- Choose your position and size, and your stop and limit levels
- Place the trade
Related tags:

The complete CFD trading experience
Award-winning platforms, competitive spreads, low commissions and dedicated support.
We live and breathe the markets and are dedicated to helping traders realise their ambitions as we continue to set the industry bar.
Economic calendar
Web Trader platform
Our sophisticated web-based platform is packed with features.
Related articles

USD/CAD forecast: rally could accelerate above June highs at 1.4250
USD/CAD recovered quickly after weaker US jobs data, keeping the bullish trend in focus. A move above the June highs could accelerate the rally as inflation keeps the Fed under pressure.

Dow Jones Slide Shows What Rate Hike Bets Mean for Stocks
The Dow Jones support breakdown shows rising bond yields and rate hike bets hitting U.S. stocks while tech giants prop up the Nasdaq.

EUR/USD forecast remains tilted lower with French bond troubles ahead of US jobs report
The EUR/USD has tagged a fresh year-to-date low as French public-finance concerns trigger a government bond sell-off. Today's US jobs report may change little, with resilient activity, elevated energy prices and hawkish Fed bets keeping the greenback supported. With the pair trapped below resistance at 1.1410, the risk to the near-term EUR/USD forecast is tilted to the downside.
StoneX Europe Ltd may make third party material available on this website which may contain information included but not limited to the conditions of financial markets. The material is for information purposes only and does not contain, and should not be construed as containing, investment advice and/or investment recommendation and/or an investment research and/or an offer of or solicitation for any transactions in financial instruments; any decision to enter into a specific transaction shall be made by the client following an assessment by him/her of their situation.
StoneX Europe Ltd makes no representation or warranty and assumes no liability as to the accuracy or completeness of the information provided, nor any loss arising from any investment based on a recommendation, forecast or other information supplied. You should always seek independent advice as to your suitability to speculate in any related markets and your ability to assume the associated risks, if you are at all unsure. We are not under any obligation to update any such material. Any opinion made may be personal to the author and may not reflect the opinion of StoneX Europe Ltd.