





Nasdaq 100, S&P 500 Feel the Force of Trump’s Tariffs, ASX to Open Lower
The relative calm seen on Wall Street these past two weeks came to an abrupt end on Wednesday in anticipation of Trump's auto tariffs. The Nasdaq led the way lower, with S&P 500 and ASX futures being dragged along for the ride.
Share this:

View related analysis:
- If Consumers Don’t Consume, a Recession Could be Presumed
- AUD/USD forecast: GBP/AUD Eyes 2020 High, Inflation Reports on Tap
- EUR/USD bears short-covered at fastest pace in 5 years - COT Report
View related analysis:
- If Consumers Don’t Consume, a Recession Could be Presumed
- AUD/USD forecast: GBP/AUD Eyes 2020 High, Inflation Reports on Tap
- EUR/USD bears short-covered at fastest pace in 5 years - COT Report
The relative calm seen on Wall Street these past two weeks came to an abrupt end on Wednesday when President Trump announced that auto tariffs are set to be announced on Wednesday night. And they have just been announced. A 25% levy will be added to all auto vehicle imports not made in the US, which he expects will result in over $100 billion of annual revenue. He is also to sign an executive order to enhance auto growth in the US.
Another round of tariffs is set to be announced on April 2nd, and that there will also be tariffs on pharmaceuticals.
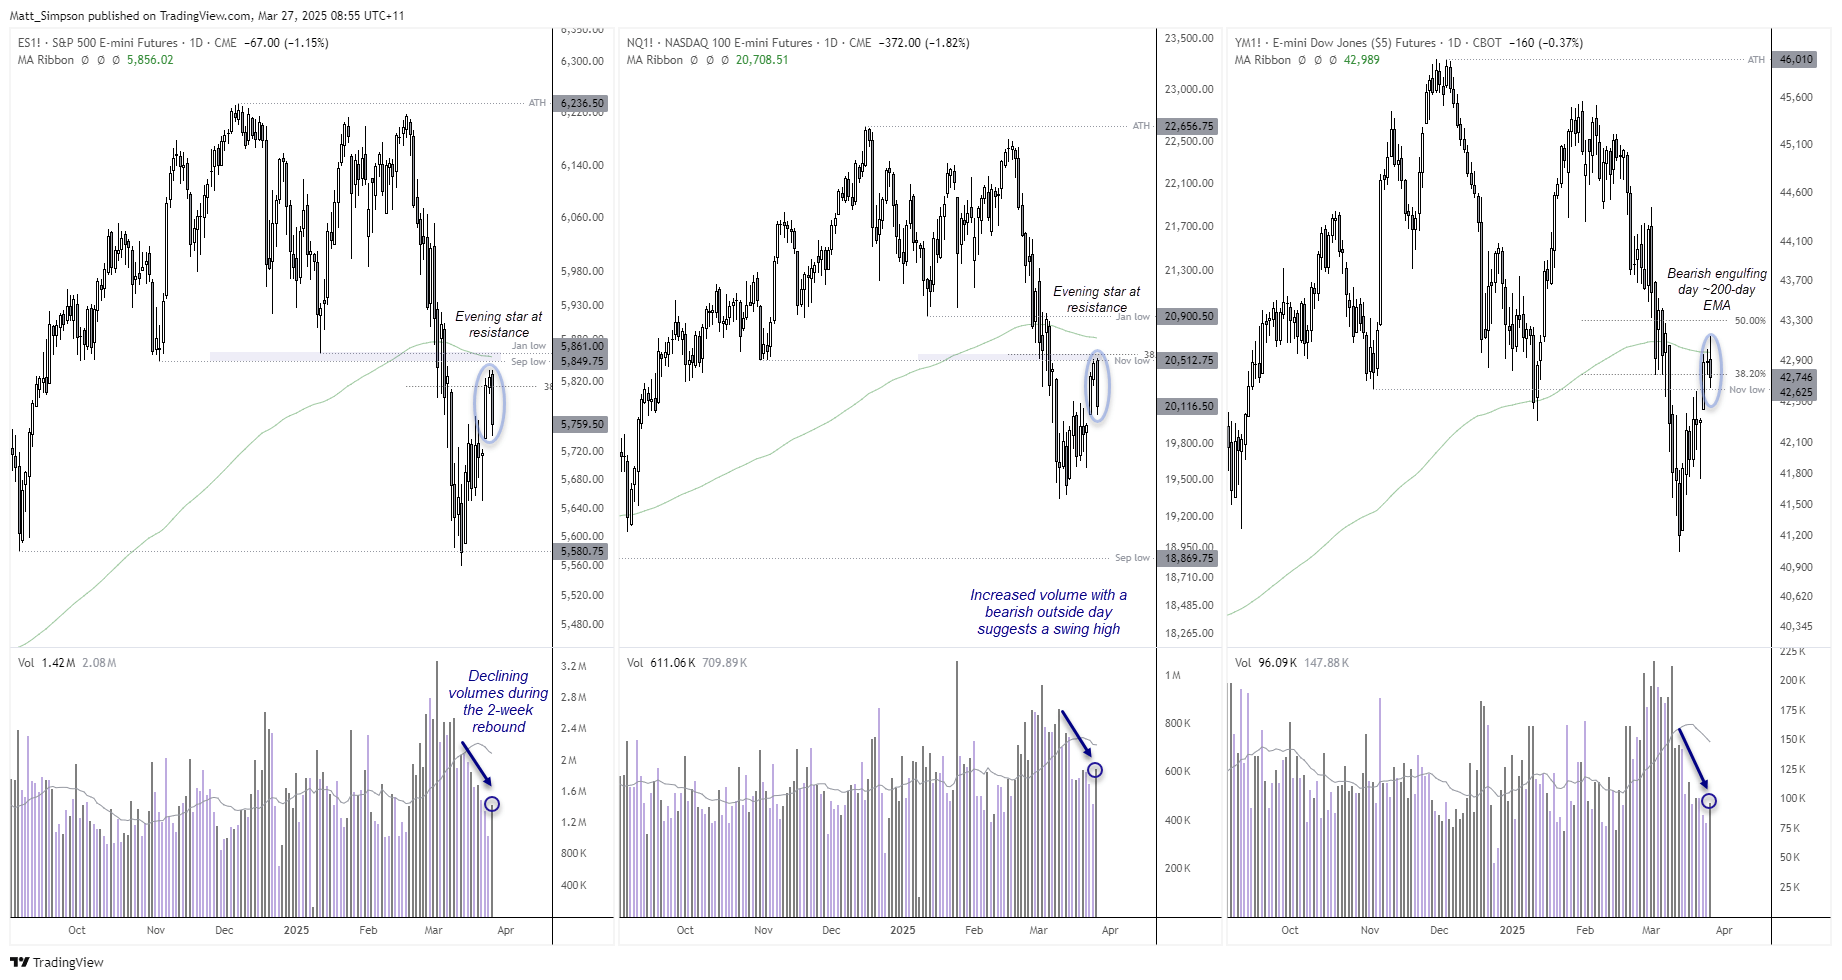
- Nasdaq 100 futures led Wall Street lower ahead of the official announcement, falling -1.8% by the close after hitting resistance around the November low and 38.2% Fibonacci ratio, and formed a bearish outside day.
- S&P 500 futures formed a bearish engulfing day to close firmly back beneath its 38.2% Fibonacci ratio.
- Dow Jones futures closed beneath its 200-day EMA after an intraday break above it, and formed a smaller bearish engulfing day just above the November low
- All three indices saw higher volume on the day, which suggests bearish initiation and a potential swing high
- The fact that volumes were declining through much of the rally of the past two weeks could suggest the bounce was corrective, which implies new lows
ASX 200 at a glance
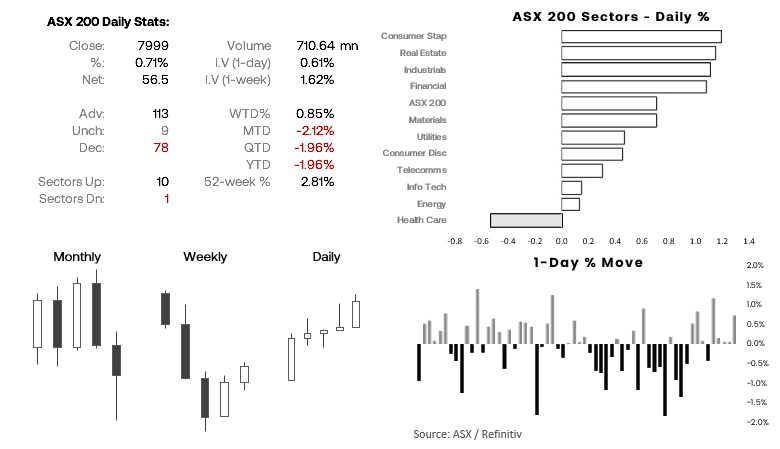
- The ASX 200 closed higher for a fifth day, although missed the 8,000 milestone by a single point by the end of the day
- 10 of its 11 sectors advanced (led by Consumer Staples and Real Estate ETFs), Healthcare was the only sector to decline
- Implied volatility continues to trend lower, allowing the ASX to extend its bounce alongside Wall Street indices in light of Trump’s tariffs not being severe as once feared
ASX 200 futures (SPI 200) technical analysis
The ASX tracked Wall Street indices higher over the past two weeks, although its 3.75% gain trailed behind its US counterparts. This could suggest that the ASX has further to fall should sentiment truly sour for risk appetite.
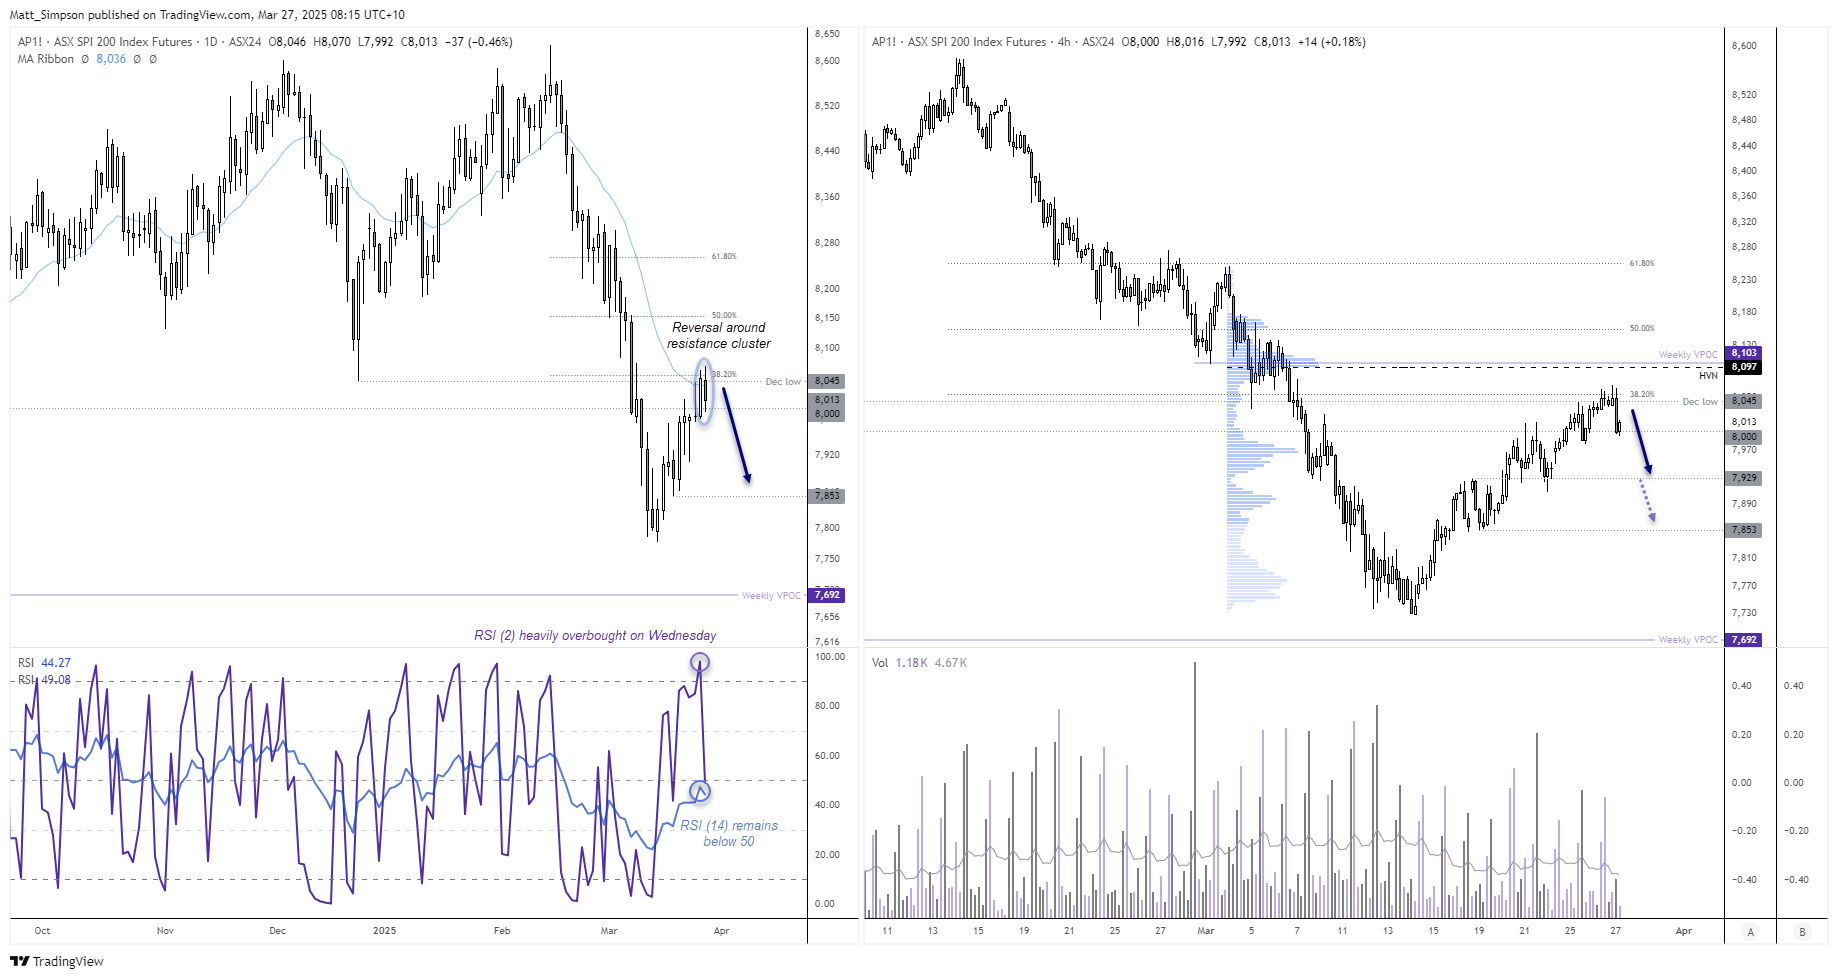
The ASX rally stalled around a resistance cluster including the December low, 38.2% Fibonacci level and 20-da EMA. The daily RSI (2) reached the highly overbought level of 98.9 on Wednesday and now sits back beneath 50. The daily RSI (14) remains beneath 50 to show negative momentum overall.
A large bearish engulfing candle formed on the 4-hour chart before the US close. Bears could seek to fade within retracements within the engulfing candle, and using a break above Wednesday’s highs or above the 8100 handle to invalidate the bearish bias.
An initial downside target could be the swing highs and lows ~7930, a break beneath which opens up a run for 7850.
Economic events in focus (AEDT)
- 10:50 – Japanese Foreigner Bond and Stock Purchases
- 12:30 – Chinese Industrial Profits YTD
- 19:30 – BoE MPC Member Dhingra Speaks
- 23:30 – US Q4 GDP, Corporate Profits, PC Prices, Goods Trade Balance (Final), Jobless Claims
-- Written by Matt Simpson
Follow Matt on Twitter @cLeverEdge
How to trade with City Index
You can trade with City Index by following these four easy steps:
- Open an account, or log in if you’re already a customer
• Open an account in the UK
• Open an account in Australia
• Open an account in Singapore
- Search for the market you want to trade in our award-winning platform
- Choose your position and size, and your stop and limit levels
- Place the trade
Latest market news




The complete CFD trading experience
Award-winning platforms, competitive spreads, low commissions and dedicated support.
We live and breathe the markets and are dedicated to helping traders realise their ambitions as we continue to set the industry bar.
Economic calendar
Web Trader platform
Our sophisticated web-based platform is packed with features.
Related articles
EUR/USD weekly outlook: FOMC and ECB to set the tone
The current backdrop is modestly bearish. On Friday, the EUR/USD closed modestly lower, down for the third consecutive day. The pair also posted a weekly decline after staging a modest recovery attempt in the previous week. Out of the past 8 weeks, the EUR/USD has fallen on 6 occasions. There is not much supporting factors for the single currency right now. So, the upside remains capped.

S&P 500, Nasdaq, Dow Forecast: Nasdaq Selloff Deepens as Dow Rally Stalls 10 24 2026
A failed S&P breakout and looming Nasdaq support test raise the stakes for next week’s Fed decision and October’s monthly close.


Silver forecast: metals liquidation drags XAG/USD into $50-55 support
Silver has broken its July low and slipped into a long-term support zone as the selling in precious metals deepens. The chart shows where the metal could bottom, and next week's Fed decision may decide whether it does.
StoneX Europe Ltd may make third party material available on this website which may contain information included but not limited to the conditions of financial markets. The material is for information purposes only and does not contain, and should not be construed as containing, investment advice and/or investment recommendation and/or an investment research and/or an offer of or solicitation for any transactions in financial instruments; any decision to enter into a specific transaction shall be made by the client following an assessment by him/her of their situation.
StoneX Europe Ltd makes no representation or warranty and assumes no liability as to the accuracy or completeness of the information provided, nor any loss arising from any investment based on a recommendation, forecast or other information supplied. You should always seek independent advice as to your suitability to speculate in any related markets and your ability to assume the associated risks, if you are at all unsure. We are not under any obligation to update any such material. Any opinion made may be personal to the author and may not reflect the opinion of StoneX Europe Ltd.