


Nasdaq volatility shock warns against buying too early
An extraordinary sell-off has left Nasdaq 100 futures deeply oversold, but history suggests further downside is common before a sustained recovery takes hold.
Share this:

- Nasdaq 100 futures suffer record points decline
- Realised-volatility shock ranks above 99th percentile dating back to 1999
- Historical drawdowns warn against premature dip buying
- Technical levels remain focal point for traders
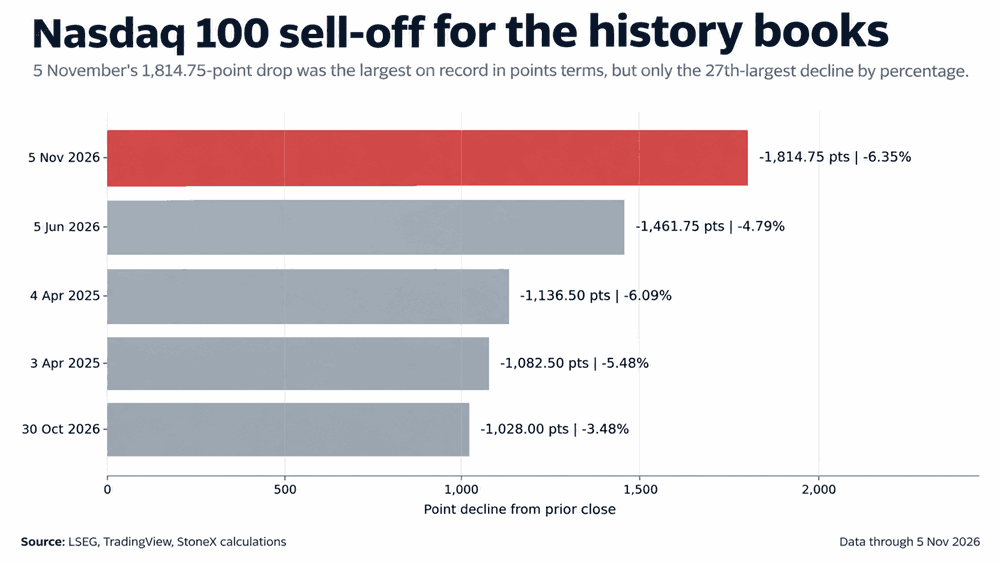
We’ve just seen one of the largest Nasdaq 100 sell-offs on record, with Thursday's decline in futures the largest in points terms since the dataset began in 1999, while the 6.35% drop ranks among the worst 0.4% of daily percentage moves.
Source: TradingView
After such a large fall, the natural question is when the rout will end, particularly for traders considering positioning for a counter-trend move. While buying the dip has proven a successful strategy over recent years, historical forward-return analysis suggests acting prematurely doesn't always pay off, particularly over shorter time frames.
A volatility shock of historic proportions
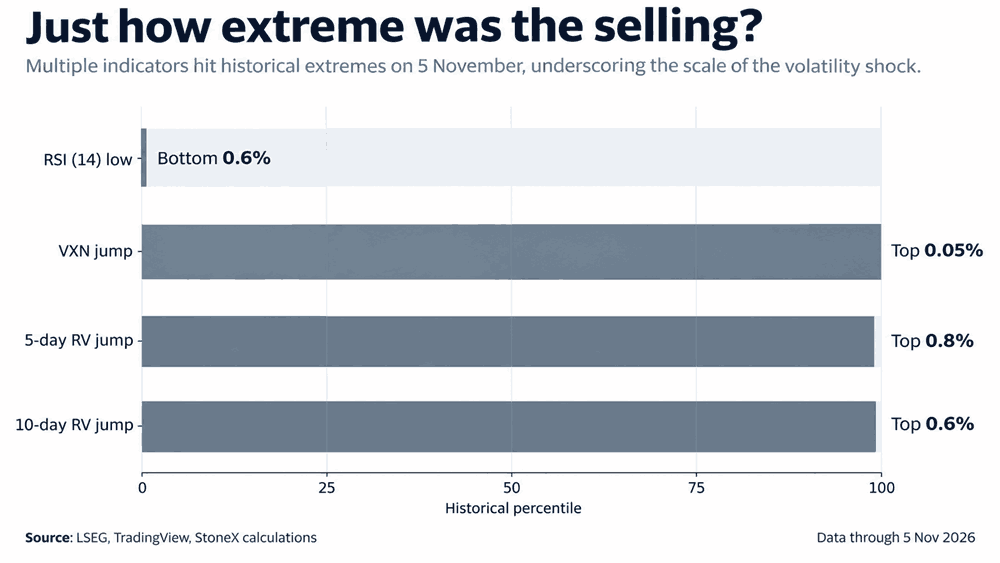
Putting the scale of Thursday's rout in perspective, it ranks right up there with some of the largest volatility shocks Nasdaq 100 futures have experienced, adding to what has already been a rough start to November.
Source: TradingView
Annualised five-session realised volatility jumped 20.77 percentage points to 49.54%, while the ten-session measure surged 12.31 points to 39.83%. Both increases ranked above the 99th percentile of historical observations going back to 1999.
Ominously, options markets expect volatility to persist, with the VXN, the Nasdaq 100 equivalent of the S&P 500's VIX index, surging 52.55% on Thursday, its fourth-largest daily percentage increase on record. However, at 38.26, the index remains well below the extremes witnessed during previous major market downturns, including the pandemic plunge and the tech wreck of the early 2000s.
History warns against buying too early
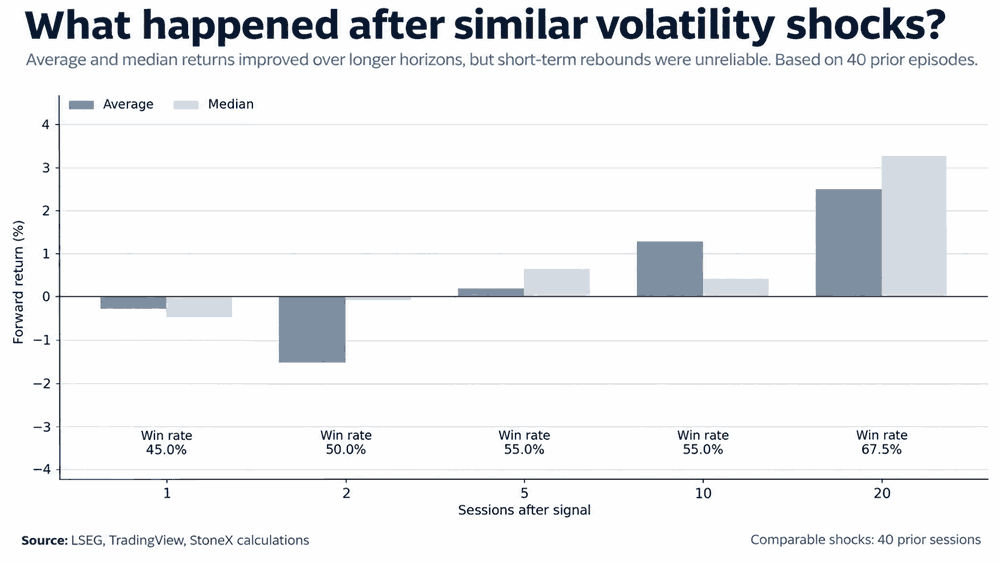
Using Thursday's increase in ten-session realised volatility as the threshold, there have been 40 comparable shocks in Nasdaq 100 futures since 1999. Historical forward-return analysis reveals substantial dispersion in outcomes, with extreme moves observed in both directions, making it difficult to draw firm conclusions about where prices are likely to head immediately after the initial shock.
Source: TradingView
While average returns were negative over the following one and two sessions, they improved over longer periods. After 20 sessions, the average gain was 2.50%, the median was 3.28%, and 67.5% of observations delivered positive returns. However, those figures conceal the considerable downside traders often faced along the way.
The historical tendency for further intraday declines is something every dip buyer should consider. Over the following 20 sessions, the average maximum drawdown from the shock-day close was 9.41%, with a median of 8.37%. In 70% of cases, prices fell at least another 5% from the closing level of the initial shock, highlighting the risk of buying prematurely even when the index subsequently recovered over longer periods.
Similar shocks, very different outcomes
Further emphasising the wide dispersion of outcomes, during the GFC in September 2008, the initial volatility shock was followed by a further intraday decline of nearly 25% over the next 20 sessions. In contrast, a similar shock in August 2011, linked to S&P's downgrade of the US credit rating and the ongoing European debt crisis, was followed by a sharp recovery, with Nasdaq 100 futures gaining 6.24% over the same period.
The pandemic provides an even more extreme example. Despite a powerful gain of more than 14% over the following 20 sessions, futures still traded more than 8% below the initial shock-day close along the way. Put simply, every sell-off has its own idiosyncratic factors that need to be considered. And while history suggests an eventual recovery is common, the drawdowns along the way can be extremely costly for premature dip buyers.
Nasdaq 100: Technical damage mounts
Source: TradingView
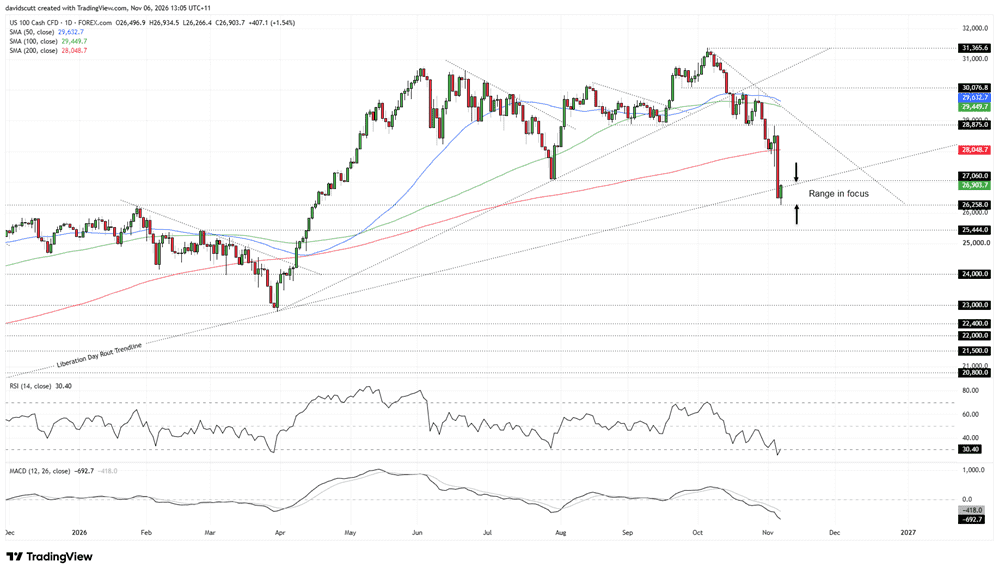
Our Nasdaq 100 contract suffered significant technical damage during Thursday's rout, with the price not only losing the 200-day moving average, but also the 27,060 low set in early July and the uptrend running from the April 2025 Liberation Day lows, before eventually bottoming at 26,258.
As the chart shows, 26,258 has previously acted as resistance during periods last year and again in early 2026, making it the immediate focal point on the downside. The fact that established technical levels continue to be respected, despite the scale of Thursday's selling, suggests we're not yet witnessing a disorderly liquidation. That makes price action within the immediate range important when assessing directional risks.
Should 26258 give way, 25,444 is the first downside level to watch, followed by 24,000 which has acted as both support and resistance on multiple occasions during 2025 and early 2026. Overhead, the former Liberation Day uptrend is located around where the price now sits, although 27,060 is the more important level overhead. A break above that would put the 200-day moving average in focus, along with 28,875, a former support level that gave way late last month.
The message from the oscillators is one of building downside momentum, favouring short setups over longs. RSI (14) continues to set lower highs and lower lows, a message reinforced by MACD, which has staged a bearish crossover, turned negative and is now diverging further from its signal line.
Still, given the scale of recent declines, the risk of a short squeeze is there, as we're seeing in Asia today. In such an environment, price action at either end of the immediate 26,258–27,060 range should take precedence over the oscillators.
Latest market news




The complete CFD trading experience
Award-winning platforms, competitive spreads, low commissions and dedicated support.
We live and breathe the markets and are dedicated to helping traders realise their ambitions as we continue to set the industry bar.
Economic calendar
Web Trader platform
Our sophisticated web-based platform is packed with features.
Related articles
Nasdaq volatility shock warns against buying too early
An extraordinary sell-off has left Nasdaq 100 futures deeply oversold, but history suggests further downside is common before a sustained recovery takes hold.
S&P 500 Update: SPX Records Its Biggest Selloff of the Year Ahead of NFP
The trading week has not been particularly favorable for risk appetite in the short term, and this is now becoming increasingly evident in the performance of the S&P 500. During today's session, the index is down nearly 4.2%, marking its largest intraday decline of 2026.

Canadian Dollar Short-term Outlook: USD/CAD Plunge Stalls at Pivotal Support—Range Break in Focus 11 5 2026
Friday’s U.S. and Canadian employment reports could trigger a decisive USD/CAD move as bulls and bears battle for control at critical support.

StoneX Europe Ltd may make third party material available on this website which may contain information included but not limited to the conditions of financial markets. The material is for information purposes only and does not contain, and should not be construed as containing, investment advice and/or investment recommendation and/or an investment research and/or an offer of or solicitation for any transactions in financial instruments; any decision to enter into a specific transaction shall be made by the client following an assessment by him/her of their situation.
StoneX Europe Ltd makes no representation or warranty and assumes no liability as to the accuracy or completeness of the information provided, nor any loss arising from any investment based on a recommendation, forecast or other information supplied. You should always seek independent advice as to your suitability to speculate in any related markets and your ability to assume the associated risks, if you are at all unsure. We are not under any obligation to update any such material. Any opinion made may be personal to the author and may not reflect the opinion of StoneX Europe Ltd.