



New Zealand Dollar Sinks After RBNZ’s Dovish 50 bp Cut
NZD/USD drops to a five-month low after the RBNZ surprises markets with a dovish 50 bp rate cut, signalling more weakness for the New Zealand dollar.
Share this:

The New Zealand dollar tumbled on Wednesday after the Reserve Bank of New Zealand (RBNZ) surprised markets with a dovish 50 bp rate cut — twice the expected 25 bp move. The decision pushed NZD/USD to a five-month low and triggered broad declines across kiwi dollar pairs, with GBP/NZD, AUD/NZD and EUR/NZD leading gains.
View related analysis:
View related analysis:
RBNZ’s Dovish Cut Sends New Zealand Dollar to Five-Month Low
The New Zealand dollar is broadly lower after the Reserve Bank of New Zealand (RBNZ) delivered a dovish 50 bp cut, compared to the consensus for a 25 bp move. With the cash rate now at 2.5%, it marks the eighth cut of the cycle, totalling -300 bp — four of which have been the full 50 bp.
Kiwi dollar pairs have already far exceeded their average daily ranges, with NZD/USD sinking to a 5-month low and falling as much as -1%. GBP/NZD, AUD/NZD and EUR/NZD are the strongest kiwi dollar crosses.
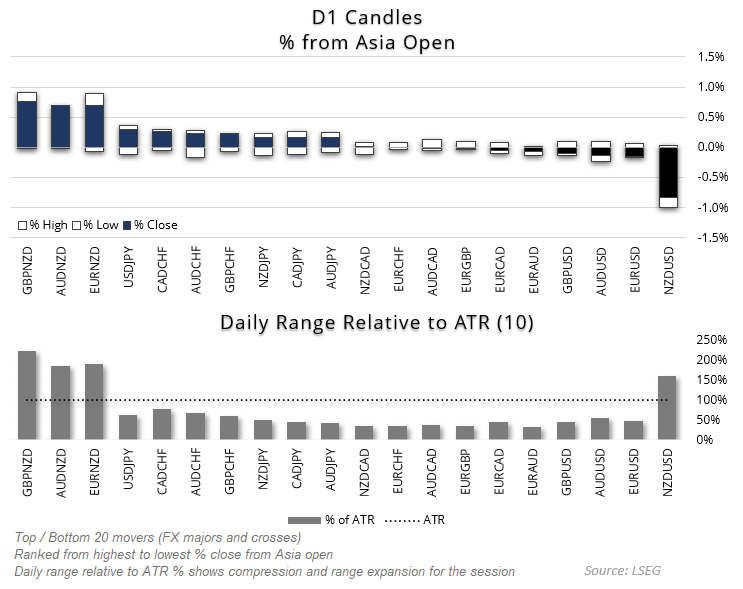
Chart prepared by Matt Simpson - data source: CME Fedwatch
With business sentiment softening and money markets bringing forward expectations for the terminal rate, the RBNZ clearly felt they were falling behind the curve.
Citing weak economic activity and “significant spare capacity”, policymakers looked through the recent rise in inflation and noted they expect CPI to return to the mid-point of their target band around mid-2026. CPI remains within the 1–3% target range for now, though growth among trading partners is also expected to slow despite its recent resilience.
A cash rate of 2.5% means it already sits below the terminal rate projected by the RBNZ in May, which was not expected until March 2026. As a result, the central bank has been forced to revise its OCR outlook lower in the past two quarterly Monetary Policy Statements. Money markets suspect another downward adjustment may be needed, with the 1-year OIS now falling to 2.2%.


NZD/USD Technical Analysis: New Zealand Dollar vs US Dollar
The New Zealand dollar continues to weaken against the US dollar and is edging closer to my 0.57 target. Further downside remains possible if domestic economic data continues to soften. However, traders entering late may prefer to wait for a period of consolidation or a corrective bounce to avoid being caught short near a potential cycle low, with NZD/USD already extending to around 150% of its 10-day ATR.
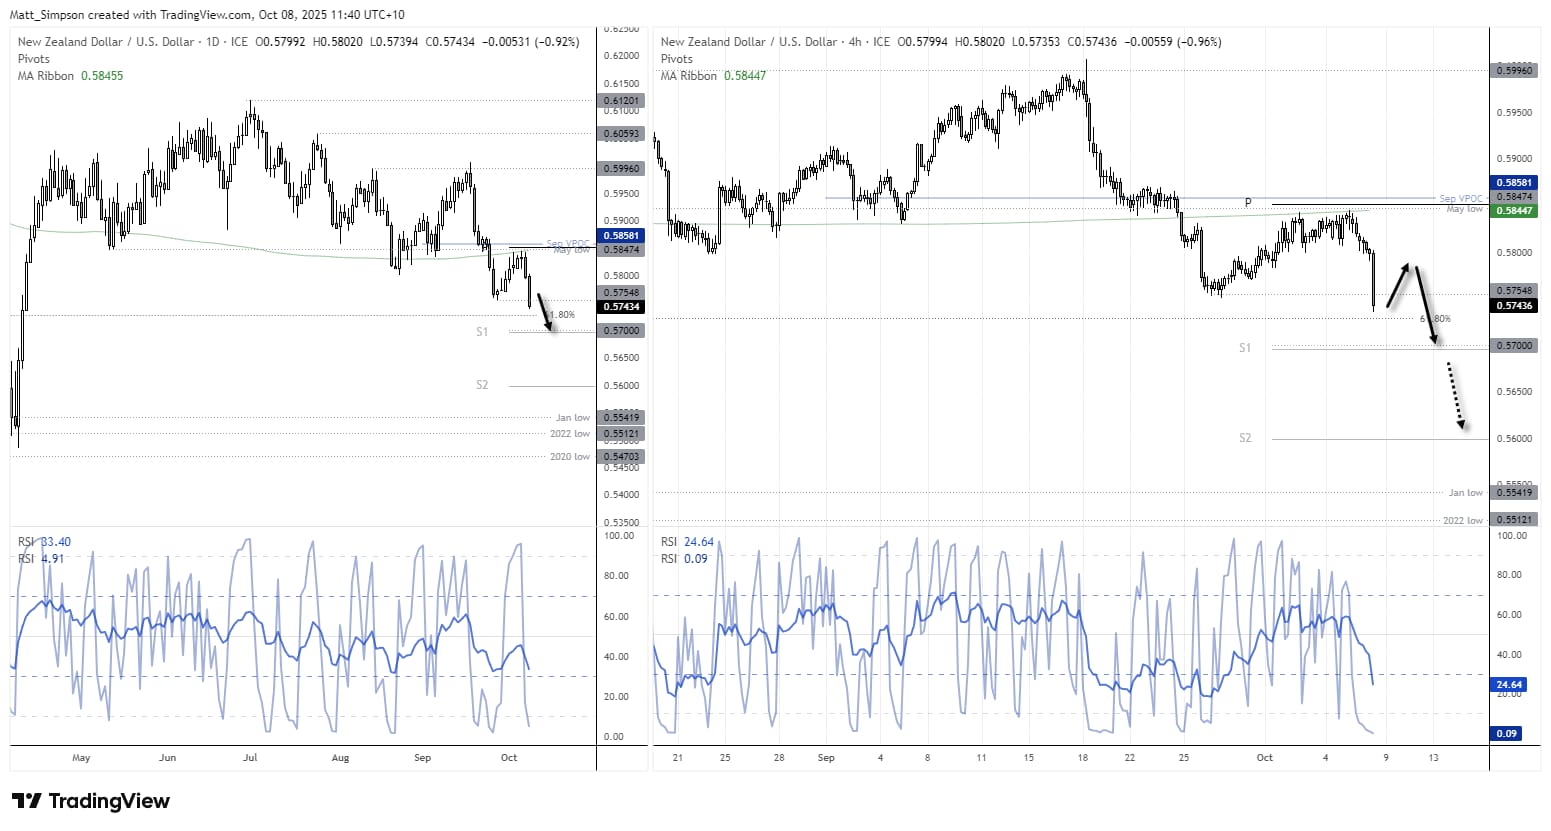
Chart analysis by Matt Simpson - data source: TradingView NZD/USD
View the full economic calendar
View the full economic calendar
-- Written by Matt Simpson
Follow Matt on Twitter @cLeverEdge
How to trade with City Index
You can trade with City Index by following these four easy steps:
- Open an account, or log in if you’re already a customer
• Open an account in the UK
• Open an account in Australia
• Open an account in Singapore
- Search for the market you want to trade in our award-winning platform
- Choose your position and size, and your stop and limit levels
- Place the trade
Related tags:
Latest market news




The complete CFD trading experience
Award-winning platforms, competitive spreads, low commissions and dedicated support.
We live and breathe the markets and are dedicated to helping traders realise their ambitions as we continue to set the industry bar.
Economic calendar
Web Trader platform
Our sophisticated web-based platform is packed with features.
Related articles
Swiss Franc Forecast: USD/CHF Seven-Week Rally Reverses From Yearly Highs 10 16 2026
A sharp rejection from fresh highs has shifted momentum in favor of USD/CHF bears, raising the stakes for a critical support test.

AUD/USD Bulls Fight Back After Australian Jobs Shock
AUD/USD has been hit by another ugly Australian employment report, sending RBA rate hike expectations sharply lower. Yet the relationships driving the currency have shifted since quarter-end, and improving risk appetite could provide the fuel for a recovery.


USD/JPY Update: Can the Japanese Yen Sustain Its Recovery?
Short-term price action around the Japanese yen has started to show some relative improvement over recent sessions. This can be seen in the recent performance of USD/JPY, which has now recorded three consecutive daily declines in favor of the Japanese currency, resulting in a depreciation of roughly 0.35% over the period.

StoneX Europe Ltd may make third party material available on this website which may contain information included but not limited to the conditions of financial markets. The material is for information purposes only and does not contain, and should not be construed as containing, investment advice and/or investment recommendation and/or an investment research and/or an offer of or solicitation for any transactions in financial instruments; any decision to enter into a specific transaction shall be made by the client following an assessment by him/her of their situation.
StoneX Europe Ltd makes no representation or warranty and assumes no liability as to the accuracy or completeness of the information provided, nor any loss arising from any investment based on a recommendation, forecast or other information supplied. You should always seek independent advice as to your suitability to speculate in any related markets and your ability to assume the associated risks, if you are at all unsure. We are not under any obligation to update any such material. Any opinion made may be personal to the author and may not reflect the opinion of StoneX Europe Ltd.