



USD/JPY Bulls On High Alert For Breakout As Japanese Yen Slumps
USD/JPY jumps as yen slumps on expectations incoming PM Takaichi will favour stimulus over BOJ tightening.
Share this:

USD/JPY extended its rally on Monday as the Japanese yen sold off sharply amid political shifts in Tokyo. Traders reacted to reports that Sanae Takaichi — a pro-stimulus candidate and vocal critic of Bank of Japan (BOJ) rate hikes — is poised to become Japan’s first female prime minister, triggering a broad yen decline and renewed interest in carry trades.
View related analysis:
View related analysis:
Japanese Yen Slumps As Takaichi’s Stimulus Agenda Takes Centre Stage
The Japanese yen was sharply lower against its FX peers on Monday, as a dovish, pro-stimulus candidate took the lead to become Japan’s next prime minister. Sanae Takaichi looks set to become Japan’s first female PM and has been a vocal critic of Bank of Japan (BOJ) rate hikes. Odds of a near-term 25bp hike have fallen from around 68% to 41%, triggering a surge in Japan’s bond market, weighing on yields and sending the yen lower across the board.
However, an advisor close to Takaichi suggested she may still tolerate one more 25bp hike. An ex-BOJ official also noted recently that she might have limited influence over the central bank even if she does take office. While it remains up in the air whether her victory would spell the end of BOJ tightening or simply slow its pace, the news was enough to prompt many yen bulls to reassess their exposure.
Commodity currencies took the lead as the carry trade sprang back into action, with AUD/JPY, CAD/JPY, and NZD/JPY all rising around 2% by Monday’s close. USD/JPY climbed 1.9% to finish above 150, while GBP/JPY accelerated beyond 200 to a 15-month high. EUR/JPY now trades at its highest level since 1991, and both CHF/JPY and the Nikkei surged to record highs, marking their best day since April.
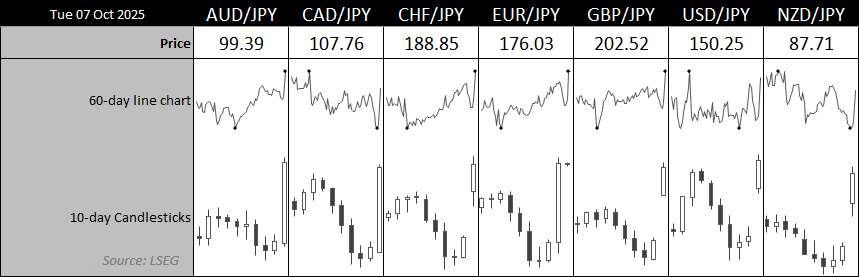
Chart prepared by Matt Simpson - Source: LSEG


Japanese Yen Futures Positioning (JPY/USD) – Weekly COT Report Analysis
Last week’s commitment of traders (COT) report shows that pre-emptive bulls were caught off guard. Net-long exposure for large speculators and asset managers rose by a combined 25.6k contracts on the week by Tuesday’s close. The proportion of which came from the initiation of fresh bullish bets, with large specs increasing their gross-long exposure to the yen by 9% and asset managers by 8%, or a combined 22.5k contracts. Large specs also reduced gross-short exposure by -3.5% (-3.6k contracts).
Many of these pre-emptive bulls may have covered their longs, and that see the yen face further selling pressure over the near term until we get greater clarity over Takaichi’s sway over the BOJ and their ability to hike interest rates.
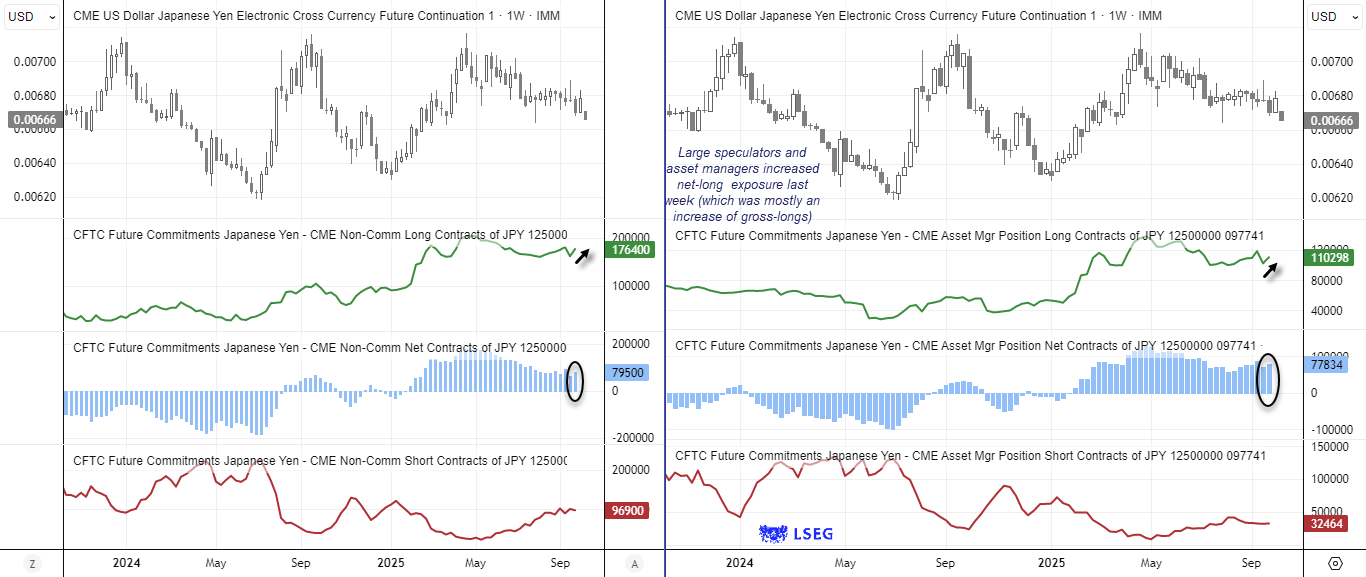
Chart prepared by Matt Simpson - Source: CME, IMM, LSEG


USD/JPY Technical Analysis: US Dollar vs Japanese Yen
The 192-pip gap from Friday’s close to Monday’s open was the largest on the USD/JPY daily chart since May 1990, which incidentally was also a gap lower from similar levels around 150. Monday’s 1.9% daily gain marked its strongest single-day performance in nine weeks and lifted USD/JPY to within 23 pips of the August high.
The surge has invalidated last week’s bearish bias and has bullish breakout traders on high alert, though a sustained rally will likely depend on confirmation that Japan’s incoming prime minister can influence the BOJ’s hiking path.
Traders will also eye Friday’s Nonfarm Payrolls for clues on the Fed outlook — a weak print could reinforce expectations for back-to-back rate cuts in October and December. For now, however, dips appear likely to attract buyers, with focus on a retest of the 151.28 double-top high.
A decisive break above that level would expose the weekly R3 pivot and the 152 handle over the near term.

Chart analysis by Matt Simpson - data source: TradingView USD/JPY
View the full economic calendar
View the full economic calendar
-- Written by Matt Simpson
Follow Matt on Twitter @cLeverEdge
How to trade with City Index
You can trade with City Index by following these four easy steps:
- Open an account, or log in if you’re already a customer
• Open an account in the UK
• Open an account in Australia
• Open an account in Singapore
- Search for the market you want to trade in our award-winning platform
- Choose your position and size, and your stop and limit levels
- Place the trade
Related tags:



The complete CFD trading experience
Award-winning platforms, competitive spreads, low commissions and dedicated support.
We live and breathe the markets and are dedicated to helping traders realise their ambitions as we continue to set the industry bar.
Economic calendar
Web Trader platform
Our sophisticated web-based platform is packed with features.
Related articles

Nasdaq 100 forecast: Tech stocks not out of woods yet
US index futures pushed higher in the first half of Friday’s session, taking cues from a strong performance from European equities. Both European and US equity futures extending yesterday’s impressive recovery after the sharp sell-off earlier in the week. But the lingering concerns around the AI investment cycle remain, while bond markets were easing lower again, lifting yields.


ASX 200 Outlook: A Rates Trade Disguised as a Stock Market?
Australian bond futures have exhibited a far stronger relationship with the ASX 200 than Wall Street over recent months. Now both markets are displaying remarkably similar price structures.


AUD/USD Bulls Fight Back After Australian Jobs Shock
AUD/USD has been hit by another ugly Australian employment report, sending RBA rate hike expectations sharply lower. Yet the relationships driving the currency have shifted since quarter-end, and improving risk appetite could provide the fuel for a recovery.
StoneX Europe Ltd may make third party material available on this website which may contain information included but not limited to the conditions of financial markets. The material is for information purposes only and does not contain, and should not be construed as containing, investment advice and/or investment recommendation and/or an investment research and/or an offer of or solicitation for any transactions in financial instruments; any decision to enter into a specific transaction shall be made by the client following an assessment by him/her of their situation.
StoneX Europe Ltd makes no representation or warranty and assumes no liability as to the accuracy or completeness of the information provided, nor any loss arising from any investment based on a recommendation, forecast or other information supplied. You should always seek independent advice as to your suitability to speculate in any related markets and your ability to assume the associated risks, if you are at all unsure. We are not under any obligation to update any such material. Any opinion made may be personal to the author and may not reflect the opinion of StoneX Europe Ltd.