



ASX 200 Morning Market Outlook: Bulls Hesitate Near Record Highs
ASX 200 nears record highs but shows hesitation with a shooting star candle, low volume, and mixed sector performance hinting at near-term caution.
Share this:

The ASX 200 reached a 30-day high on Monday, coming within 28 points of its all-time peak from late August. However, momentum stalled as a shooting star candle signalled hesitation near record territory. Despite five sectors advancing, overall volume remained subdued for a second session — hinting that traders may be waiting for stronger conviction before driving the next breakout.
View related analysis:
View related analysis:
ASX 200 Near Record Highs but Bulls Show Caution
ASX 200 Market Snapshot
- The ASX 200 reached a 30-day high on Monday, with the daily high reaching just 28 points (0.3%) below its record peak from 25 August.
- Five of eleven sectors advanced, led by Materials (+0.6%) and Utilities (+0.4%), while Real Estate was flat (+0.02%).
- Six sectors declined, with Information Technology (-1.4%) and Healthcare (-0.9%) leading losses.
- A small shooting star candle formed on the daily chart, signalling hesitation among bulls near record highs.
- Trading volumes were below average and lower for a second consecutive session, suggesting reduced confidence in the short-term rally.

Chart analysis by Matt Simpson - data source: ASX, LSEG
ASX 200 Sector Performance
Technology remains the standout performer, up 33.6% over the past six months. However, momentum is shifting toward Materials (+21.2%), which are now matching Energy (+22.5%) as the most resilient cyclical sectors. I continue to suspect Energy may have formed at least a short-term base after its recent pullback from year-to-date highs.
Only Healthcare (-1.35%) and Consumer Staples (-4.8%) have declined during this period, highlighting that overall ASX 200 sector breadth remains supportive of the broader index.

Chart analysis by Matt Simpson - data source: ASX, LSEG


ASX 200 Futures Intraday Levels
The ASX 200 futures are consolidating within Monday’s shooting star candle, just below the record high. While the RSI (14) continues to trend higher without entering overbought territory, suggesting the broader uptrend remains intact, short-term hesitation may lead to choppy trade or a minor pullback before another attempt higher.
On the 1-hour chart, the 9,000 area aligns with the monthly R1 pivot, creating a potential support zone for dip buyers. A break below this could expose the 8,939–8,950 region, defined by the September high and monthly pivot.
To the upside, 9,100 remains a logical target for bulls, positioned between the weekly R1 and monthly R2 pivots.
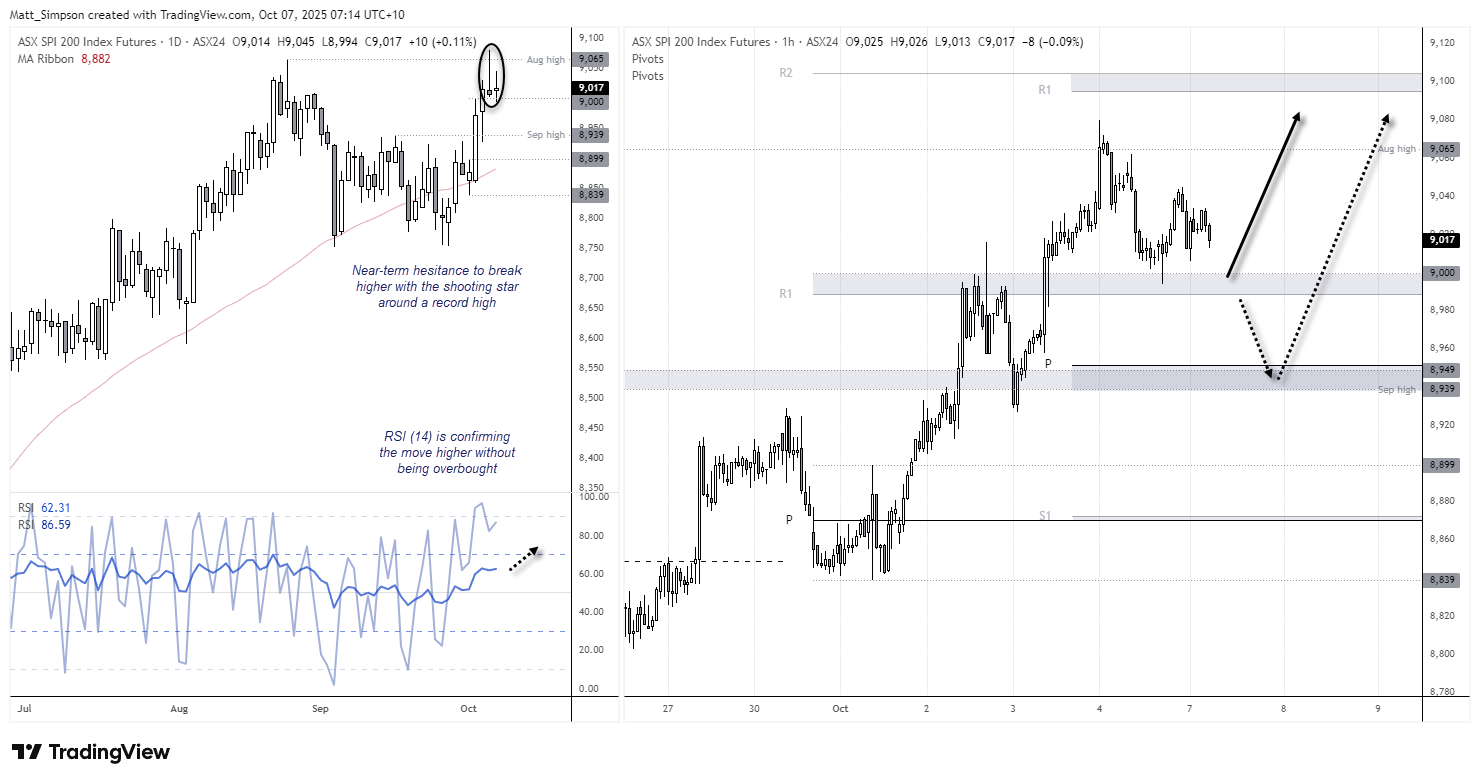
Chart analysis by Matt Simpson - Source: TradingView, ASX SPI 200 Index Futures
View the full economic calendar
View the full economic calendar
-- Written by Matt Simpson
Follow Matt on Twitter @cLeverEdge
How to trade with City Index
You can trade with City Index by following these four easy steps:
- Open an account, or log in if you’re already a customer
• Open an account in the UK
• Open an account in Australia
• Open an account in Singapore
- Search for the market you want to trade in our award-winning platform
- Choose your position and size, and your stop and limit levels
- Place the trade
Related tags:
Latest market news




The complete CFD trading experience
Award-winning platforms, competitive spreads, low commissions and dedicated support.
We live and breathe the markets and are dedicated to helping traders realise their ambitions as we continue to set the industry bar.
Economic calendar
Web Trader platform
Our sophisticated web-based platform is packed with features.
Related articles

EUR/USD, USD/JPY Outlook: Oil, yields and an FX identity crisis
Crude oil is setting the tone across rates and FX, leaving EUR/USD vulnerable and USD/JPY caught between higher Treasury yields and the growing threat of intervention


EUR/USD, USD/JPY Forecast: Fed Hike Bets Ease, Yen Weakness Does Not
Softer Fed rate hike pricing has not derailed the USD/JPY rebound, while EUR/USD continues to grind higher into US CPI.

Japanese Yen Outlook: USD/JPY Plunge Loses Steam, but Risks Remain
USD/JPY is attempting to stabilise after its sharpest 2-day decline in 4 years, but Fed-backed support for Japan could keep rallies on a short leash.
StoneX Europe Ltd may make third party material available on this website which may contain information included but not limited to the conditions of financial markets. The material is for information purposes only and does not contain, and should not be construed as containing, investment advice and/or investment recommendation and/or an investment research and/or an offer of or solicitation for any transactions in financial instruments; any decision to enter into a specific transaction shall be made by the client following an assessment by him/her of their situation.
StoneX Europe Ltd makes no representation or warranty and assumes no liability as to the accuracy or completeness of the information provided, nor any loss arising from any investment based on a recommendation, forecast or other information supplied. You should always seek independent advice as to your suitability to speculate in any related markets and your ability to assume the associated risks, if you are at all unsure. We are not under any obligation to update any such material. Any opinion made may be personal to the author and may not reflect the opinion of StoneX Europe Ltd.