



S&P 500 Analysis: SPX ends the week with positive momentum
A new bullish bias has started to gain relevance in the S&P 500, which is up 2.00% over the last two sessions, mainly supported by corporate earnings that have helped sustain short-term market confidence.
Share this:

A new bullish bias has started to gain relevance in the S&P 500, which is up 2.00% over the last two sessions, mainly supported by corporate earnings that have helped sustain short-term market confidence. However, uncertainty remains around what the Federal Reserve could do over the coming months, and this could pressure the market again later. For now, if positive earnings continue to drive the index’s behavior, buying pressure could remain relevant over the next few trading sessions.


Earnings help support confidence
Although the earnings season started with some weakness, especially after companies such as Alphabet raised concerns about elevated artificial intelligence spending, the dynamic changed meaningfully toward the end of the week. Results from companies such as Amazon and Microsoft helped improve market sentiment and reinforced confidence in the stability of some of the index’s largest companies.
In Microsoft’s case, the company reported revenue of 90 billion dollars, representing growth of around 18% year over year. Earnings per share came in at 4.74 dollars, above expectations of 4.24 dollars, while revenue from Azure and other cloud services grew more than 43%. These figures helped restore confidence in the company’s financial stability and potential growth.
Amazon also stood out during the week. The company reported earnings per share of 1.97 dollars, above the 1.82 dollars expected, while revenue surpassed the 200-billion-dollar mark in the latest quarter. The focus was AWS, which grew 37% year over year to 42.2 billion dollars. Amazon said this was the fastest growth rate for AWS in 18 quarters, once again showing strong acceleration in its cloud services business.
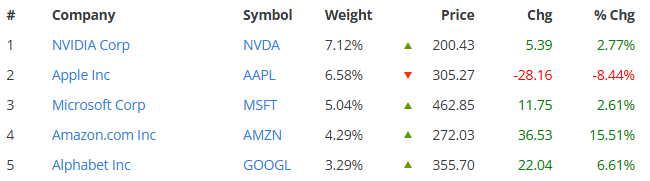
To some extent, the results from both companies helped ease concerns about the impact of artificial intelligence spending on major U.S. companies. As two of the most important components of the S&P 500, gains in Microsoft and Amazon helped support demand for the index. This allowed the main components of the SPX to show broadly positive performance toward the final session of the week, with Apple’s weakness standing out as one of the main exceptions after its earnings release.
Source: Slickcharts
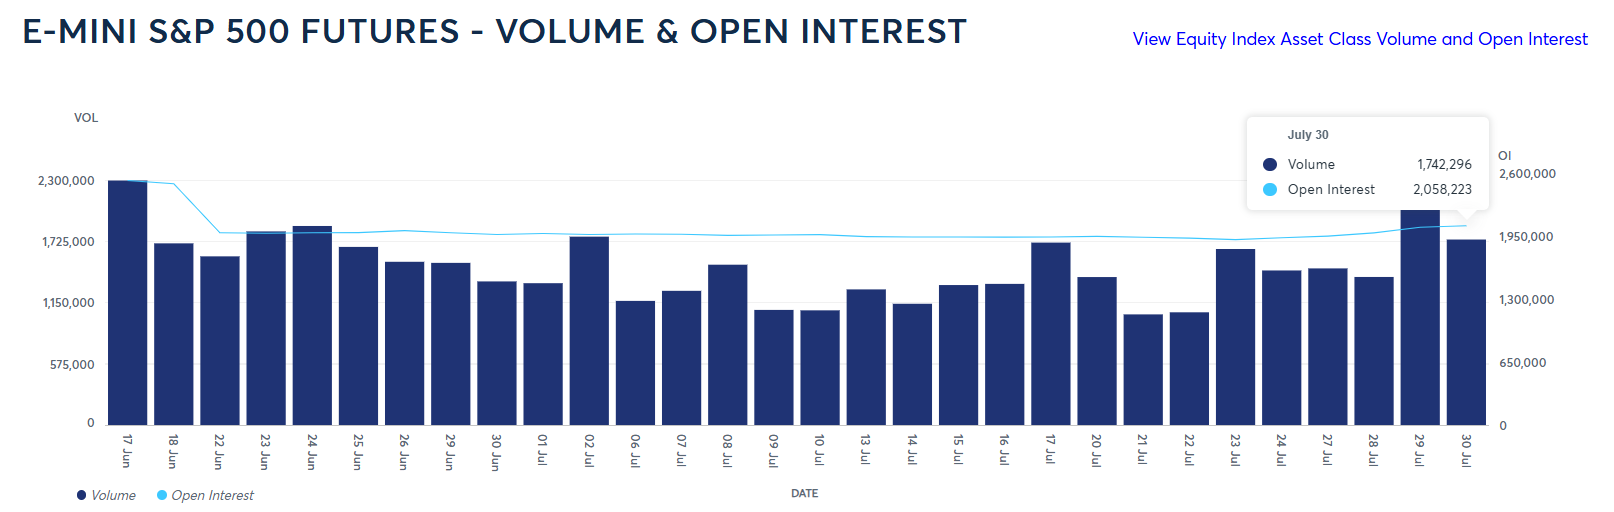
It is also important to note that, after the positive earnings releases, activity in S&P 500 futures regained relevance. In E-mini S&P 500 futures, trading volume on July 30 surpassed 1.7 million contracts, while Open Interest, which measures the total number of open buy and sell positions, also showed a slight increase above 2 million. This dynamic suggests that activity remained solid after strong results from key companies in the index. In addition, the increase in Open Interest alongside the advance in SPX could point to the entry of new buying positions over the last few sessions.
Source: CMEGROUP
With all this in mind, earnings from some companies have helped sustain demand around the index in the short term. However, this impulse could prove temporary if other relevant companies still pending, such as Nvidia, fail to confirm financial stability through their results. If upcoming reports continue to deliver a positive reading, buying pressure could gain more strength; but if signs of weakness begin to appear, the S&P 500 could return to a phase of indecision over the next few trading sessions.
Fed announcements ease tensions
The Federal Reserve’s decision during the week was also relevant. The central bank kept interest rates in the 3.75% reference area, and its comments did not point to a clear urgency to raise rates in the next meetings. Since the market had been expecting a potentially more aggressive stance, the lack of a stronger signal reduced part of the expectations for higher rates in the short term.
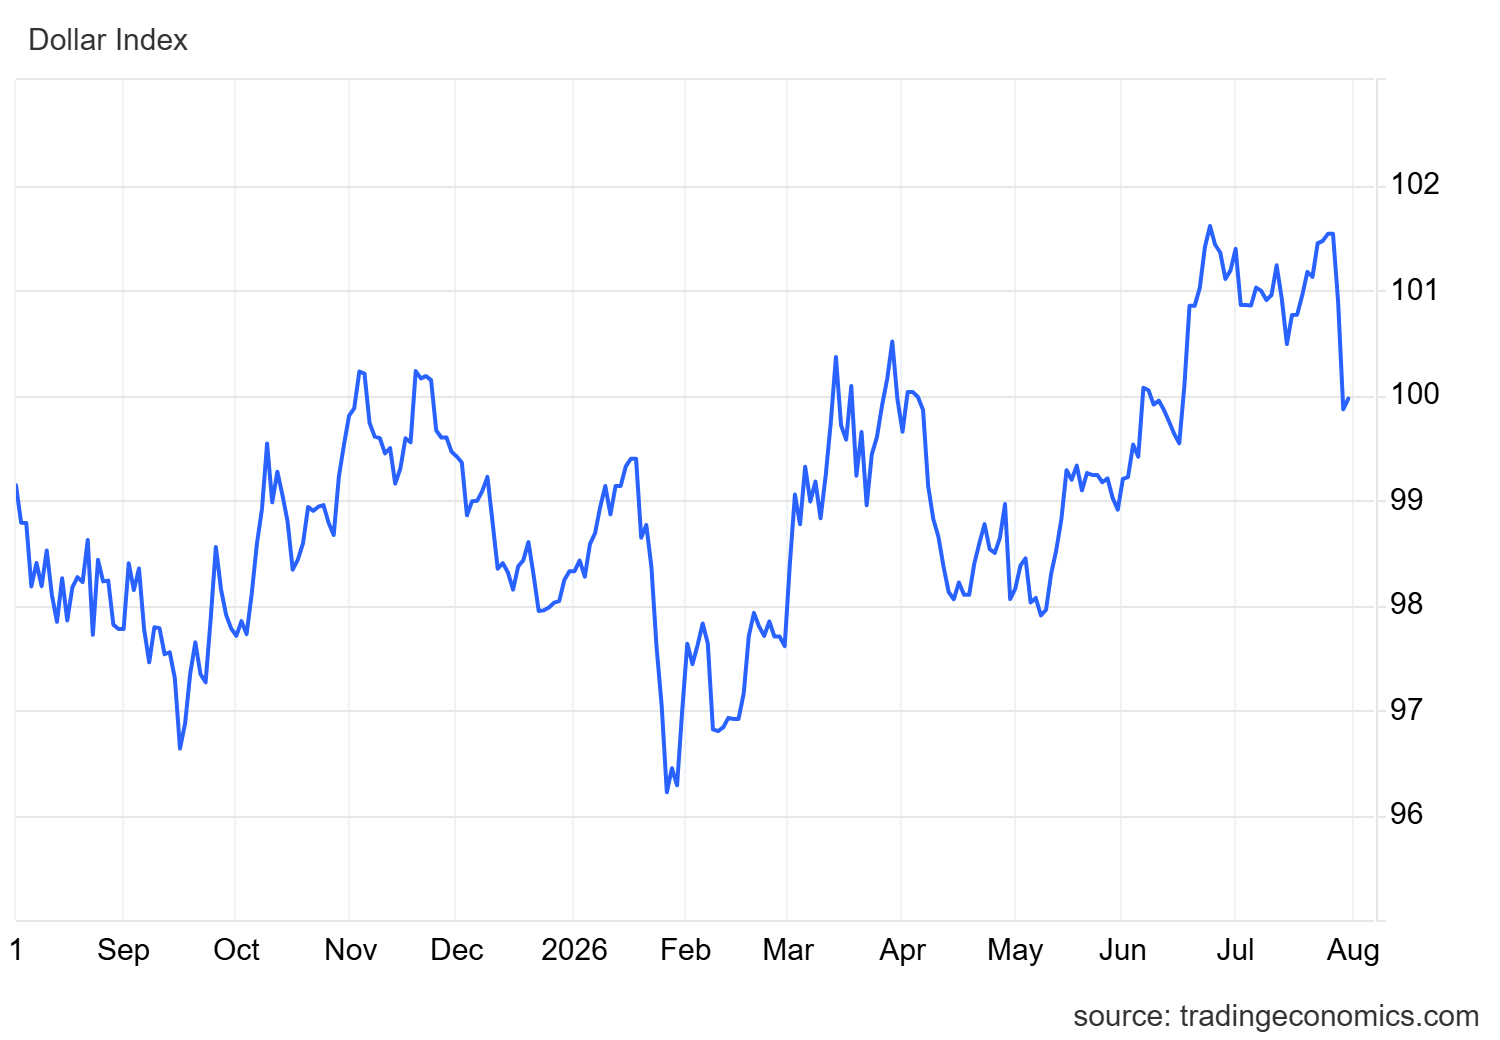
This dynamic started to reduce the appeal of dollar-denominated investments and weighed on demand for the U.S. currency. This was reflected in the DXY index, which measures the dollar’s strength against its main peers. By the end of the week, the index was still showing a relevant decline and was trading slightly below the 100-point area, reflecting weaker short-term demand for the dollar.
Source: TradingEconomics
This move is important because sustained dollar weakness can reflect lower demand for liquidity-driven safe-haven assets and can ease some pressure on risk assets. In addition, if the Fed does not move quickly toward new rate hikes, U.S. consumption could remain more stable, which would be positive for corporate sales and, by extension, for the equity market.
This environment helped stabilize risk appetite in indices such as the S&P 500. However, if the Federal Reserve once again signals possible hikes in September, pressure could return. In that case, the dollar could regain appeal as a substitute market and once again limit demand for risk assets, potentially bringing indecision back into SPX.
S&P 500 technical forecast
Source: StoneX, Tradingview
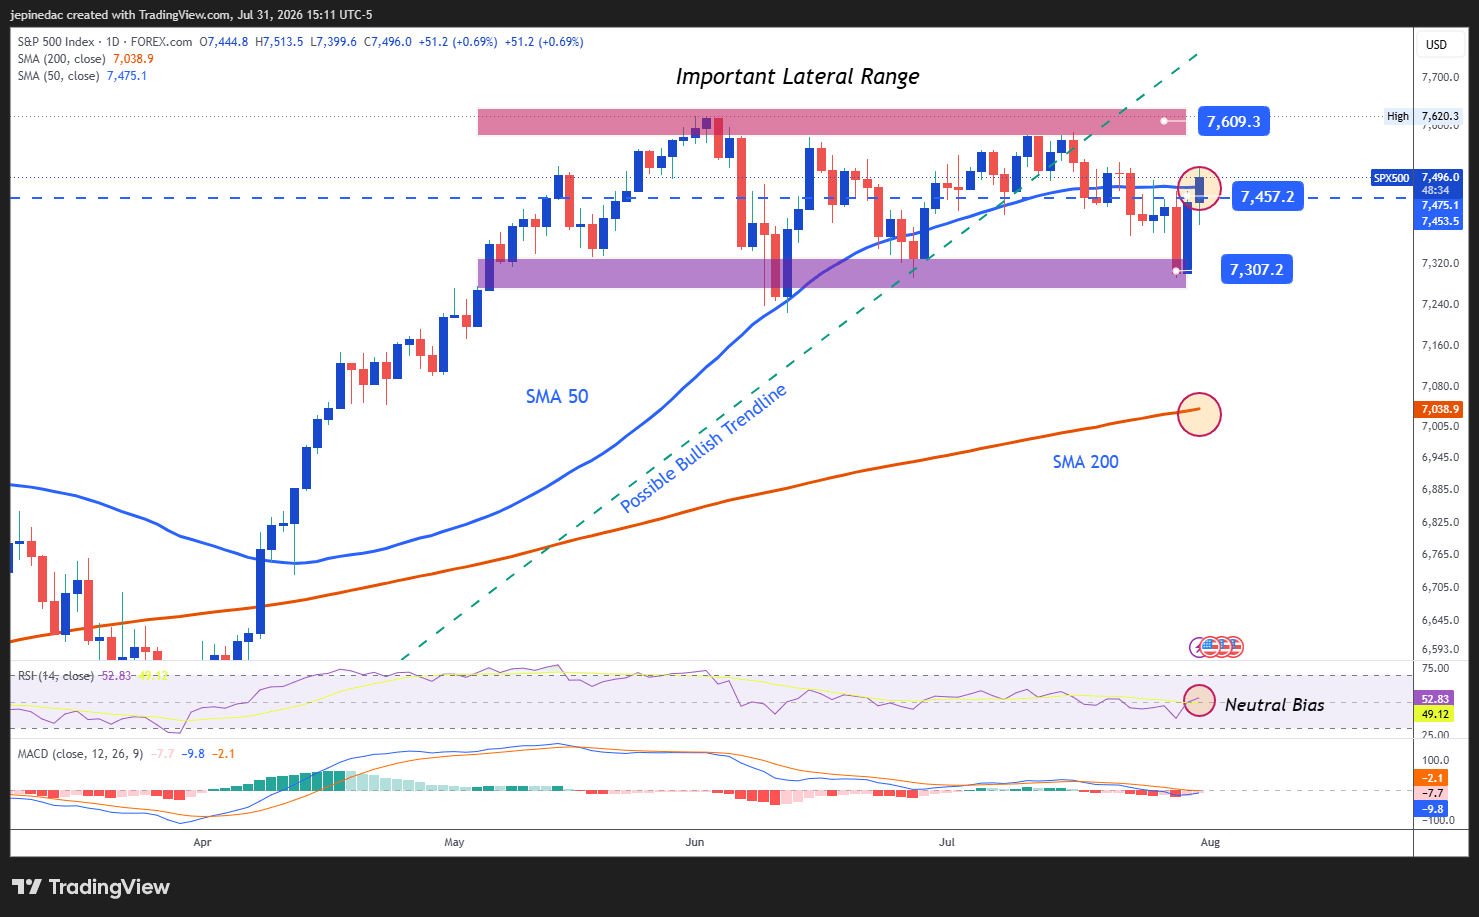
- The sideways range continues to dominate: For several weeks, the S&P 500 has been moving within a relevant sideways range, with an upper barrier near 7,600 points and a lower zone around 7,300 points. Although price has shown a recent recovery, the move has still not been strong enough to define a clear direction outside these levels. For this reason, the sideways range remains the most important technical structure on the chart and could continue to act as the main reference if the market fails to stabilize more consistent buying pressure.
- RSI: Recent RSI movements remain close to the neutral 50 level, suggesting a balance between buying and selling impulses over the last 14 sessions. As long as this behavior continues, price neutrality could remain relevant in the short term.
- MACD: A similar scenario can be seen in the MACD, with the histogram remaining very close to the neutral 0 line. This suggests balance in the strength of short-term moving averages and reinforces the possibility that indecision remains present on the chart.
Key levels:
- 7,600 points – Relevant resistance: This area corresponds to the index’s all-time highs and remains the main bullish reference. A move toward this level could strengthen the buying bias and reactivate the bullish trend seen in previous weeks as a relevant structure for the coming trading weeks.
- 7,450 points – Near-term barrier: This level acts as an important neutral zone, as it coincides with recent pullbacks and the 50-period simple moving average. If price continues to move near this reference, the phase of indecision could extend and keep the sideways range in place as the dominant structure.
- 7,300 points – Key support: This area coincides with relevant lows from recent weeks and remains the main bearish barrier. Sustained moves below this level could reinforce the selling bias and open the door to more consistent downside pressure over the coming weeks.
Written by Julian Pineda, CFA, CMT – Market Analyst
Follow him on: @julianpineda25



The complete CFD trading experience
Award-winning platforms, competitive spreads, low commissions and dedicated support.
We live and breathe the markets and are dedicated to helping traders realise their ambitions as we continue to set the industry bar.
Economic calendar
Web Trader platform
Our sophisticated web-based platform is packed with features.
Related articles

S&P 500 Another Thursday Bounce After CPI-Fueled Sell-Off
Carnage may be overstating it a bit given that fresh ATHs were printed just a week ago but if you were reading the headlines, it would certainly seem to be more than just a -2.28% pullback from the high.


US Dollar Technical Outlook: DXY, Treasury Yields Retreat Despite Hot CPI 10 15 2026
The US Dollar is testing major support despite hotter inflation as Fed pushback cools yields and forces markets to reassess the path for tightening.


S&P 500 Forecast: SPX Falls after hot inflation and as AI debt concerns mount
U.S. stocks are falling after hotter-than-expected readings on producer prices and retail sales, while concerns over AI-related debt are also mounting.

StoneX Europe Ltd may make third party material available on this website which may contain information included but not limited to the conditions of financial markets. The material is for information purposes only and does not contain, and should not be construed as containing, investment advice and/or investment recommendation and/or an investment research and/or an offer of or solicitation for any transactions in financial instruments; any decision to enter into a specific transaction shall be made by the client following an assessment by him/her of their situation.
StoneX Europe Ltd makes no representation or warranty and assumes no liability as to the accuracy or completeness of the information provided, nor any loss arising from any investment based on a recommendation, forecast or other information supplied. You should always seek independent advice as to your suitability to speculate in any related markets and your ability to assume the associated risks, if you are at all unsure. We are not under any obligation to update any such material. Any opinion made may be personal to the author and may not reflect the opinion of StoneX Europe Ltd.