



S&P 500 forecast: Technical Tuesday | September 1, 2026
Risk appetite has been hurt today with global stocks, gold, bonds and bitcoin all falling. On the ascendency were the usual suspects: Oil and the US dollar amid further escalating tensions between the US and Iran. Stock investors are cementing hawkish Fed expectations to an extent that it is starting to hurt their appetite for risk. Also unnerving investors is the continued rise in global bond yields – which kind of goes hand in hand with oil prices.
Share this:

Risk appetite has been hurt today with global stocks, gold, bonds and bitcoin all falling. On the ascendency were the usual suspects: Oil and the US dollar amid further escalating tensions between the US and Iran. Stock investors are cementing hawkish Fed expectations to an extent that it is starting to hurt their appetite for risk. Also unnerving investors is the continued rise in global bond yields – which kind of goes hand in hand with oil prices. Against this backdrop, the near-term risks to our S&P 500 forecast remains tilted to the downside.
Before discussing the macro risks further, let’s have a quick look at the chart of the S&P 500 first.
Technical S&P 500 forecast and key levels to watch
From a technical analysis point of view, the S&P 500 forecast is yet to turn bearish despite some not-so-strong price action in the last few days. But is it about to succumb to rising macro risks?
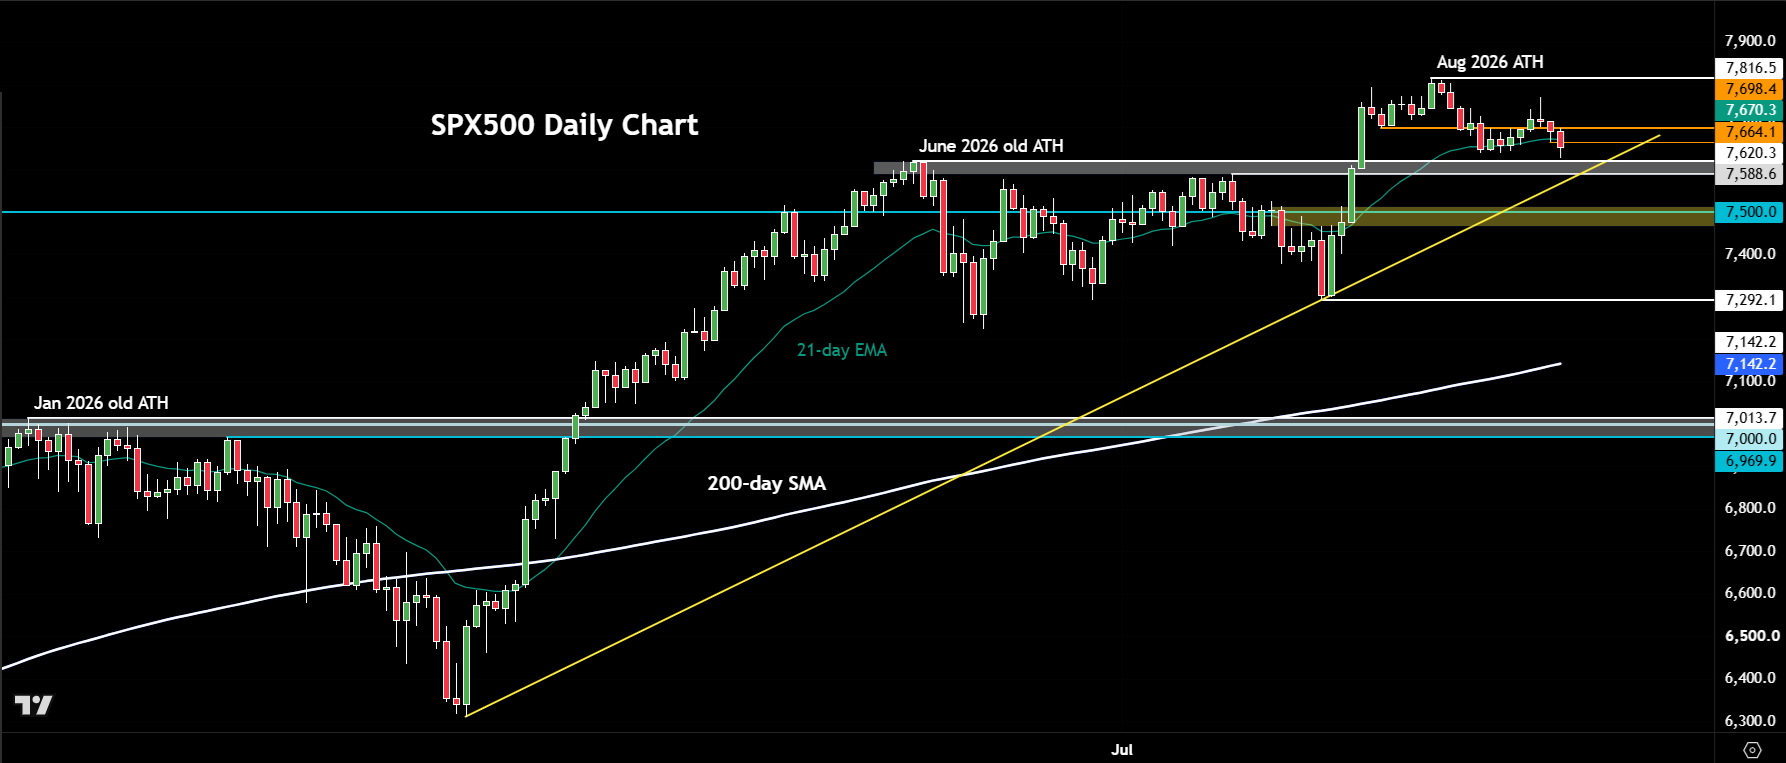
We have seen our US SP 500 index, which is derived from the underlying S&P 500 futures, make a lower high at 7771, relative to its all-time high at 7816 that was hit in mid-August. That has left traders wondering whether we will now see a proper correction.
Well, a lot now depends on the key support zone that is approaching between 7588 to 7620. Here, the index had made its previous all-time high in June, which led to a period of consolidation before the index broke out. Once resistance, will we see this zone turn into support now? If not, and we go below it, then that would be a bearish technical development. in that scenario, we could see some follow-up technical selling towards 7500 next. Below that the July low of 7292 would then come into focus.
On the upside, resistance is seen around 7664, marking Monday’s low. Above that, 7698 is the next resistance. That level held yesterday, leading to the latest drop.
For now, there are some tentative bearish signals but with the larger bullish structure still intact, it is far too early to declare the end of the bullish S&P 500 forecast from a technical analysis point of view. But that could change soon.
Rising oil prices reignite inflation worries
Higher oil prices are threatening to reignite inflation, raising the risks of righter monetary policy. Fed Chair Kevin Warsh’s hawkish Jackson Hole speech has already put a September rate hike firmly back on the table. This is reflected in the global bond markers selling off, sending yields higher across the curve.
In the US, the 10-year bond yield has climbed to a fresh 19-month high and is now only a couple of basis points below its highest level since 2007.
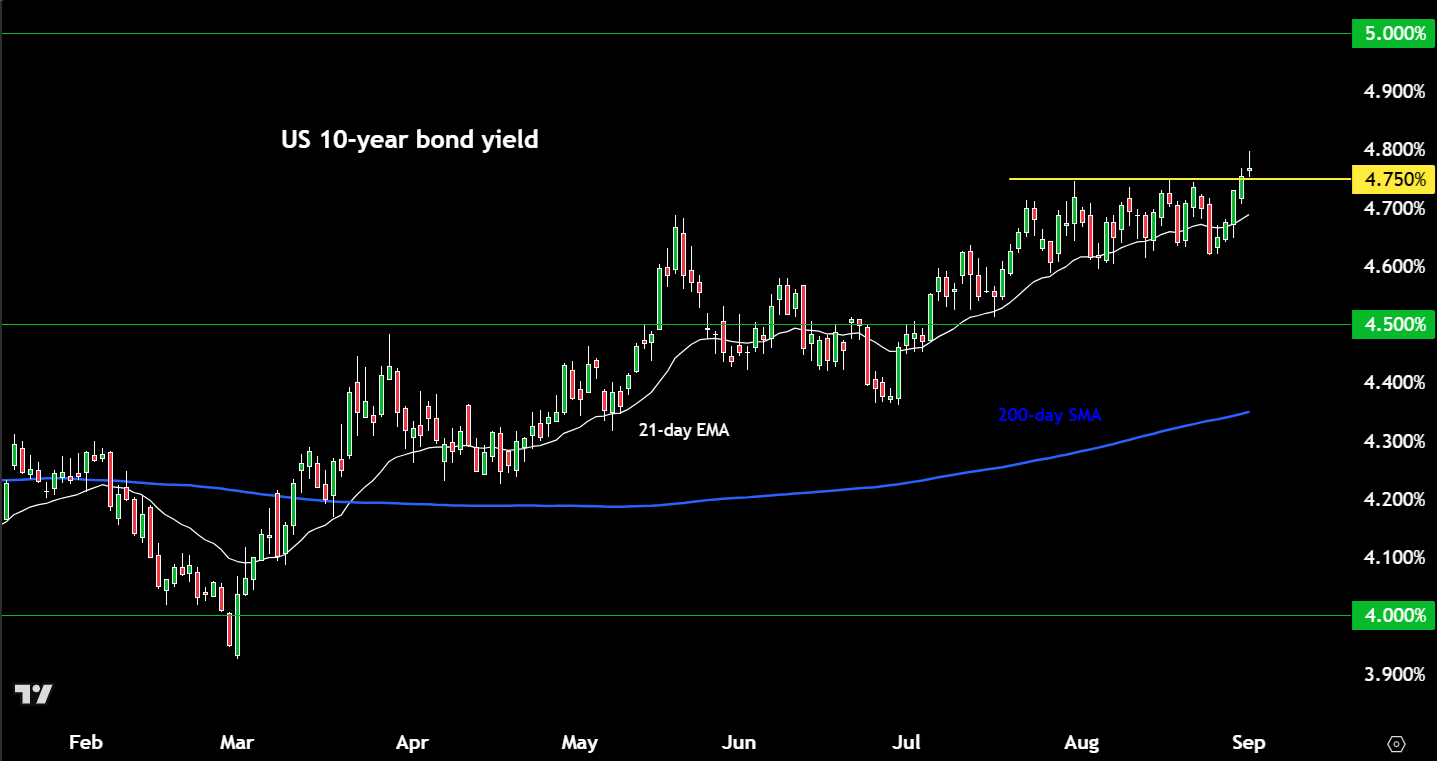
A classis ascending triangle breakout is what we have just seen. Usually, this sort of a breakout precedes further gains.
The 30-year yield has also pushed through recent highs, while Japan’s 30-year yield has broken above 4.18%, a record.
It was only two weeks ago that the US Treasury announced measures aimed at supporting the bond market, yet yields have continued to climb. The market increasingly appears willing to test the authorities’ tolerance for higher borrowing costs. With US debt now above $40tn, a sustained move in the 10-year yield towards 5% would have meaningful fiscal consequences.
With yields on the rise, this is increasing the opportunity cost of holding stocks and putting particular pressure on higher-valued, long-duration sectors such as technology.
Jobs and CPI hold the key
The question now is whether incoming US data can further cement expectations of a September rate hike. Markets have one more payrolls report, due on Friday, and one more CPI release, due next week, before the September 16 FOMC meeting, alongside several secondary indicators this week.
The payrolls report on Friday will be particularly important. With the Fed increasingly data dependent, the market is likely to react sharply to any meaningful surprise. Ahead of that, the focus will be on oil prices and bond markets for fresh signals. Any further gains in either of those markets could weigh on equity markets.

-- Written by Fawad Razaqzada, Market Analyst
Follow Fawad on Twitter @Trader_F_R
Latest market news




The complete CFD trading experience
Award-winning platforms, competitive spreads, low commissions and dedicated support.
We live and breathe the markets and are dedicated to helping traders realise their ambitions as we continue to set the industry bar.
Economic calendar
Web Trader platform
Our sophisticated web-based platform is packed with features.
Related articles
US Dollar Short-term Outlook: USD Rally on the Line as Midterms, NFP Loom 11 3 2026
DXY is testing pivotal support, with the weekly range breakout likely to determine the next major leg of the trend as key event risk unfolds.

Nasdaq 100 forecast: Stocks rebound but AI concerns linger
The Nasdaq 100 was finding some support at 28,000 after recent sell-off amid concerns about the AI trade. Even with oscillators oversold, the risk to the near-term forecast is tilted to the downside.
Australian Dollar Technical Outlook: AUD/USD October Breakout Reverses Toward Critical Support 11 3 2026
Aussie bulls face a critical test of rising trend support, with the October recovery under threat as selling pressure builds into November.
StoneX Europe Ltd may make third party material available on this website which may contain information included but not limited to the conditions of financial markets. The material is for information purposes only and does not contain, and should not be construed as containing, investment advice and/or investment recommendation and/or an investment research and/or an offer of or solicitation for any transactions in financial instruments; any decision to enter into a specific transaction shall be made by the client following an assessment by him/her of their situation.
StoneX Europe Ltd makes no representation or warranty and assumes no liability as to the accuracy or completeness of the information provided, nor any loss arising from any investment based on a recommendation, forecast or other information supplied. You should always seek independent advice as to your suitability to speculate in any related markets and your ability to assume the associated risks, if you are at all unsure. We are not under any obligation to update any such material. Any opinion made may be personal to the author and may not reflect the opinion of StoneX Europe Ltd.