



Signs of life emerge in battered Hang Seng Tech
Supportive news flow and bullish reversal signal has put Hang Seng Tech back on the radar. Here's why 4,400 is the level to watch.
Share this:
- Reversal signal shifts focus to 4,400
- Supportive news flow lifts China tech sentiment
- Break above 4,400 may target 4,620
Hang Seng Tech may have just delivered a near-term bottoming signal
There have been plenty of false dawns for Chinese tech over the past year, meaning this one deserves a healthy degree of scepticism. Even so, the combination of price action and increasingly supportive news flow suggests it's at least worth paying attention to.
Reports suggesting Chinese AI models continue to close the gap on the global leaders have helped reinforce the view the country remains a serious player in the AI race. Hong Kong is also seeing another wave of technology IPOs, with AI, autonomous driving and semiconductor firms lining up to raise fresh capital. On the mainland, Beijing is also making it easier for strategic technology companies to list domestically, another sign policymakers remain committed to supporting the sector. Valuations also remain cheap relative to regional and US rivals.
While none necessarily explain the recent price action, taken together they point to a more supportive backdrop for the sector than we've seen for some time.
Whether that's coincidence or not is open to debate. But it does make what's happening on the chart a little more interesting.
Source: TradingView
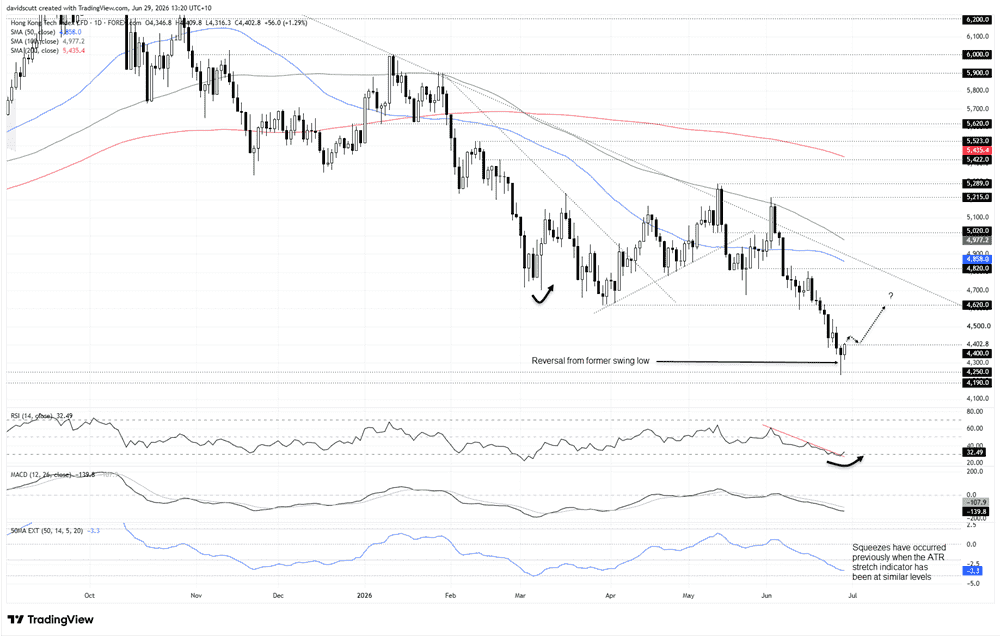
Hang Seng Tech printed a clear hammer candle from 4,250 late last week, the same swing low established back in April last year. After such an elongated bearish trend, it's the type of price action you often see when selling pressure begins to exhaust.
Of course, a hammer candle on its own proves nothing. Confirmation is needed. That's why I'm watching 4,400 closely.
The index bounced from that level last week and is testing it again today. A move above 4,400, particularly on a closing basis, may strengthen the case that a near-term low is in place. I'd have greater confidence if the breakout was followed by a successful back-test and bounce from the level. Importantly, a close above 4,400 would also complete a bullish reversal pattern on the Hang Seng Tech futures contract, providing confirmation across both markets.
If buyers can maintain the recent momentum, or extend it further, one option for those looking to position for upside may be to consider longs above 4,400 with a tight stop beneath the level, initially targeting 4,620, the breakdown zone from where the latest bearish move began.
If 4,620 were to give way, attention may then shift towards 4,820, a level that's acted as both support and resistance, along with the 50-day moving average and long-running downtrend resistance from the October 2025 highs. The downtrend, in combination with the 100-day moving average, has repeatedly proven to be formidable resistance, often sparking major bearish reversals.
Like the price action, momentum indicators are also becoming a little more encouraging. RSI (14) has broken the downtrend that had been in place throughout much of June and is starting to edge higher. At 33, it still points to weak momentum, while MACD has yet to confirm the improvement, suggesting some caution remains warranted.
However, the indicator that's caught my eye is the ATR stretch shown in the lower pane, which measures how extended the price is from the 50DMA relative to recent volatility. While the current reading isn't overly extreme, similar readings have often coincided with some form of short-term squeeze higher.
Latest market news




The complete CFD trading experience
Award-winning platforms, competitive spreads, low commissions and dedicated support.
We live and breathe the markets and are dedicated to helping traders realise their ambitions as we continue to set the industry bar.
Economic calendar
Web Trader platform
Our sophisticated web-based platform is packed with features.
Related articles
US Dollar, GBP/USD, USD/CAD, USD/CHF, Gold Weekly Technical Outlook 11 2 2026
Sr. Technical Strategist Michael Boutros highlights the levels that matter on the USD Majors, commodities, and equity indices charts this week.
US Midterm Forecast: The Key Risks for Traders to Watch Through the US Elections
Prediction markets are pricing in nearly 75% odds of a Democratic sweep in this week’s US midterm elections, a development that would result in a split from the single party Republican rule of the past two years - what will it mean for markets?

Gold forecast: XAU/USD stabilised after recent falls – for now
Gold has started the first week of the new month trying to recover some ground after another bruising week. Oil prices have taken a sharp drop and that has allowed risk assets to bounce back, which has clearly helped the precious metal too. However, with sentiment remaining bearish towards the metals, and with $4000 level having been taken out last week, the path of least resistance is to the downside for gold.

StoneX Europe Ltd may make third party material available on this website which may contain information included but not limited to the conditions of financial markets. The material is for information purposes only and does not contain, and should not be construed as containing, investment advice and/or investment recommendation and/or an investment research and/or an offer of or solicitation for any transactions in financial instruments; any decision to enter into a specific transaction shall be made by the client following an assessment by him/her of their situation.
StoneX Europe Ltd makes no representation or warranty and assumes no liability as to the accuracy or completeness of the information provided, nor any loss arising from any investment based on a recommendation, forecast or other information supplied. You should always seek independent advice as to your suitability to speculate in any related markets and your ability to assume the associated risks, if you are at all unsure. We are not under any obligation to update any such material. Any opinion made may be personal to the author and may not reflect the opinion of StoneX Europe Ltd.