




Singapore swing, anyone?
We’ve noticed an interesting technical lsetup on USD/SGD, although with the FOMC meeting just hours away it could be a make or break moment for the setup.
Share this:

We’ve noticed an interesting technical setup on USD/SGD, although with the FOMC meeting just hours away it could be a make or break moment for the setup.
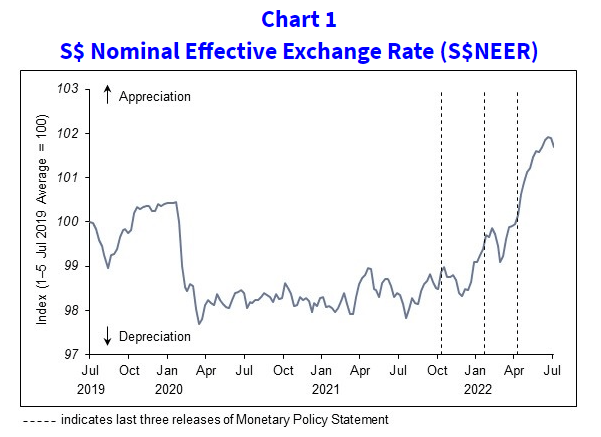
The Singapore dollar is a tightly controlled currency, and its direction and strength is controlled by the MAS (Monetary Authority of Singapore). They opt to control their currency to control inflation over interest rates, and we can see in the chart below that they have guided the strength of their currency higher whilst inflation has continued to overshoot. The NEER is a weighted basket of currencies which is not publicly divulged, but we can at least assume that USD/SGD would be trading much higher were it not for the rising NEER.
The MAS expect growth for key trading partners to slow significantly in H2, and Singapore’s growth is expected to moderate further in 2023. Inflationary pressures are expected to remain elevated in the months ahead, which could send core CPI above 4% before pulling back – although upside risks to inflation remain. This means the MAS are likely to retain an upwards trending NEER in a controlled manner. But whilst the Fed continue to hike rates aggressively, it leaves the potential for further gains on USD/SGD.
As mentioned, the MAS don’t target interest rates – but we have noted a positive correlation between USD/SGD and the SORA (Singapore overnight domestic average) interest rate. The SORA is a volume-weighted average rate of borrowing transactions in the unsecured overnight interbank SGD cash market in Singapore. Both the SORA and USD/SGD topped around the 2nd week of July but, on a relative basis, USD/SGD has seen a deeper pullback. Assuming the SORA rate remains elevated it could provide another pillar of support for USD/SGD.
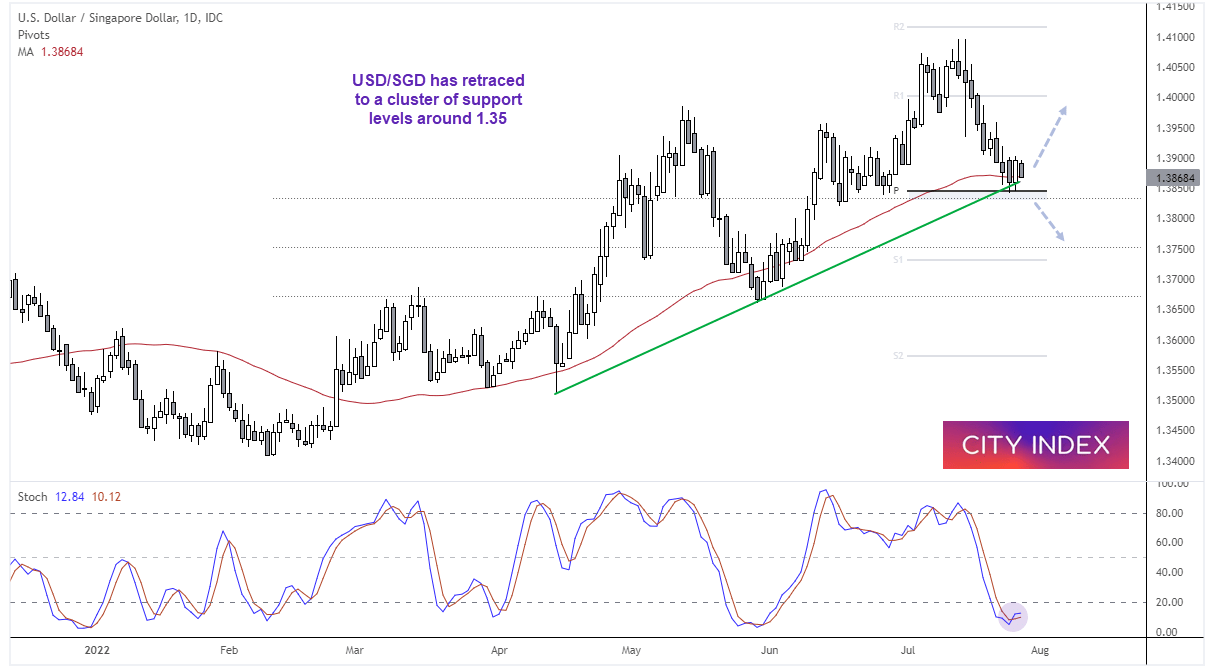

The daily chart of USD/SGD remains in an established uptrend, although the pair has retraced towards a cluster of support around 1.3835/50. This week’s low has respected the monthly pivot point and bullish trendline, prices are meandering around the 50-day eMA and the 38.2% Fibonacci ratio is nearby. Furthermore, the stochastic oscillator has generated a buy signa in the overbought zone. From a purely technical standpoint is appears ripe for a swing low to form and continue its trend higher. And a 100-bp hike today could potentially help with that scenario. Conversely, should momentum turn lower then a break beneath the support zone sends a clear warnings that all is not well with this trend, and brings the 1.3750 support zone into focus.
Keep in mind that we are just hours away from another historic FOMC meeting, where markets are currently favouring another 75-bp hike. But there is ~25% chance of a 100-bp hike, and that doesn’t appear to have been priced into the dollar given it has retraced from its cycle highs. Either way, volatility can be expected and traders would be wise to tread carefully, or step aside until after the meeting.
How to trade with City Index
You can easily trade with City Index by using these four easy steps:
- Open an account, or log in if you’re already a customer
• Open an account in the UK
• Open an account in Australia
• Open an account in Singapore
- Search for the company you want to trade in our award-winning platform
- Choose your position and size, and your stop and limit levels
- Place the trade
How to trade with FOREX.com
Follow these easy steps to start trading with FOREX.com today:
- Open a Forex.com account, or log in if you’re already a customer.
- Search for the pair you want to trade in our award-winning platform.
- Choose your position and size, and your stop and limit levels.
- Place the trade.
Latest market news




The complete CFD trading experience
Award-winning platforms, competitive spreads, low commissions and dedicated support.
We live and breathe the markets and are dedicated to helping traders realise their ambitions as we continue to set the industry bar.
Economic calendar
Web Trader platform
Our sophisticated web-based platform is packed with features.
Related articles
USD/JPY Forecast: Is Rising Japanese Inflation Supporting the Yen?
As the trading week comes to an end, one of the most relevant developments in the FX market has been the renewed strength of the Japanese yen. This can be seen in the recent performance of USD/JPY, which has fallen nearly 1.0% over the last two trading sessions, highlighting a meaningful recovery in the Japanese currency against the U.S. dollar.
Silver forecast: metals liquidation drags XAG/USD into $50-55 support
Silver has broken its July low and slipped into a long-term support zone as the selling in precious metals deepens. The chart shows where the metal could bottom, and next week's Fed decision may decide whether it does.

Australian Dollar Forecast: AUD/USD Support Reversal Sparks Monthly Range Breakout 10 23 2026
A sharp reversal off key support has fueled the AUD/USD recovery, with resistance now in focus ahead of next week’s Fed decision and Australian CPI.

StoneX Europe Ltd may make third party material available on this website which may contain information included but not limited to the conditions of financial markets. The material is for information purposes only and does not contain, and should not be construed as containing, investment advice and/or investment recommendation and/or an investment research and/or an offer of or solicitation for any transactions in financial instruments; any decision to enter into a specific transaction shall be made by the client following an assessment by him/her of their situation.
StoneX Europe Ltd makes no representation or warranty and assumes no liability as to the accuracy or completeness of the information provided, nor any loss arising from any investment based on a recommendation, forecast or other information supplied. You should always seek independent advice as to your suitability to speculate in any related markets and your ability to assume the associated risks, if you are at all unsure. We are not under any obligation to update any such material. Any opinion made may be personal to the author and may not reflect the opinion of StoneX Europe Ltd.