



S&P 500 risk-on means higher levels for yen pairs!
Will yen pairs move higher if stocks continue to move higher? Based on the daily correlation between the S&P 500 and yen pairs, it seems likely!
Share this:

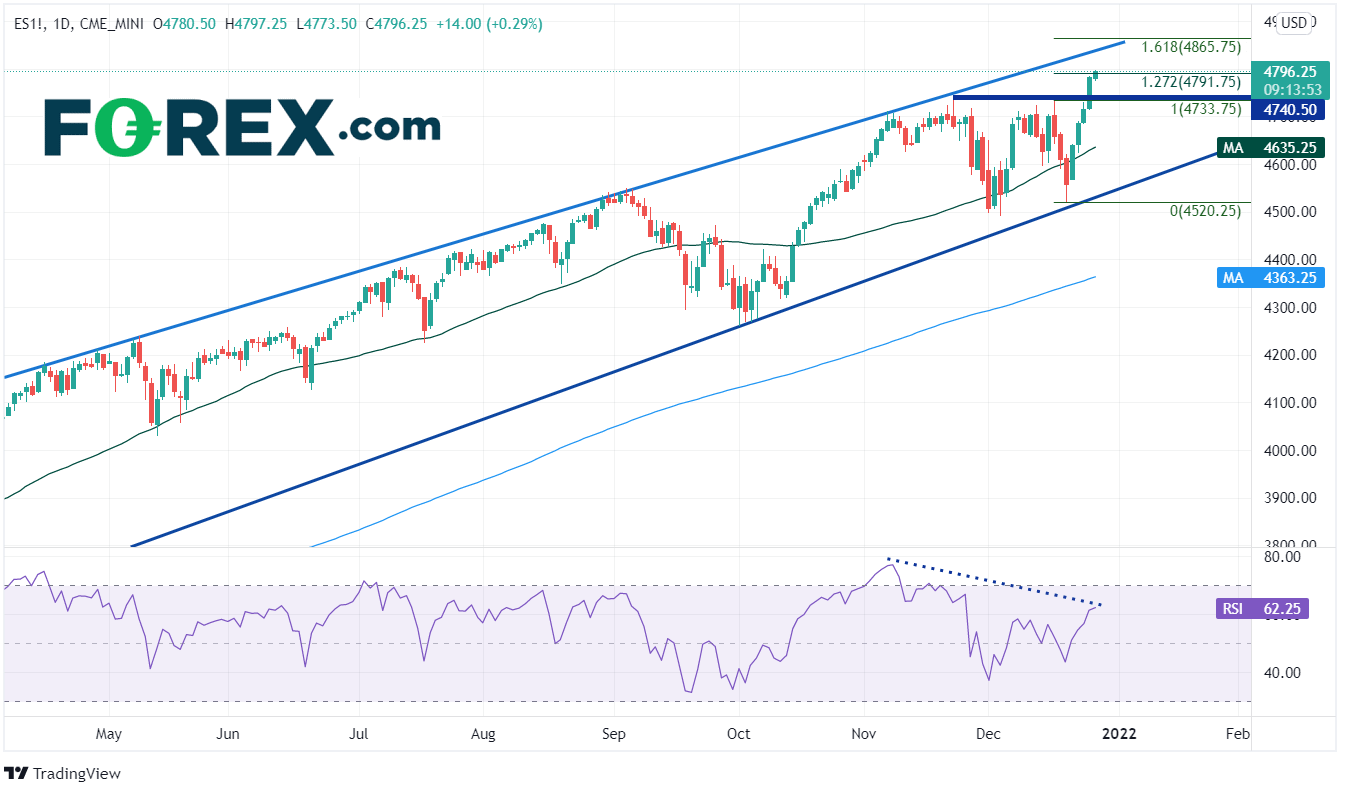
We can talk fundamentals all you want. We can talk technicals until we are blue in the face. The fact of the matter is that the S&P 500 (as shown by Emini Futures to include overnight ranges) have gone one-way over the past 4 trading sessions: up! Santa Clause rally, sure. Year-end rally, why not? Call it whatever you want. But with many major houses finished trading for the year, this leaves an opportunity for those left to push the markets around in size, as volume and liquidity are light. If large pension funds need to get something done, they could move the markets. Indeed, S&P 500 is up nearly 5% over the last 4 trading sessions. There is no indication that the index is ready to let up (barring any surprise news). The RSI is diverging from price in a big way, yet price continued higher over the last 4 days. First resistance is at the top upward sloping trendline near 4840 and then the 161.8% Fibonacci retracement level from the highs of December 16th to the lows of December 20th at 4865.75. First support is at previous highs of 4733.75, then the 50-Day Moving Average at 4635.25.
Source: Tradingview, Stone X
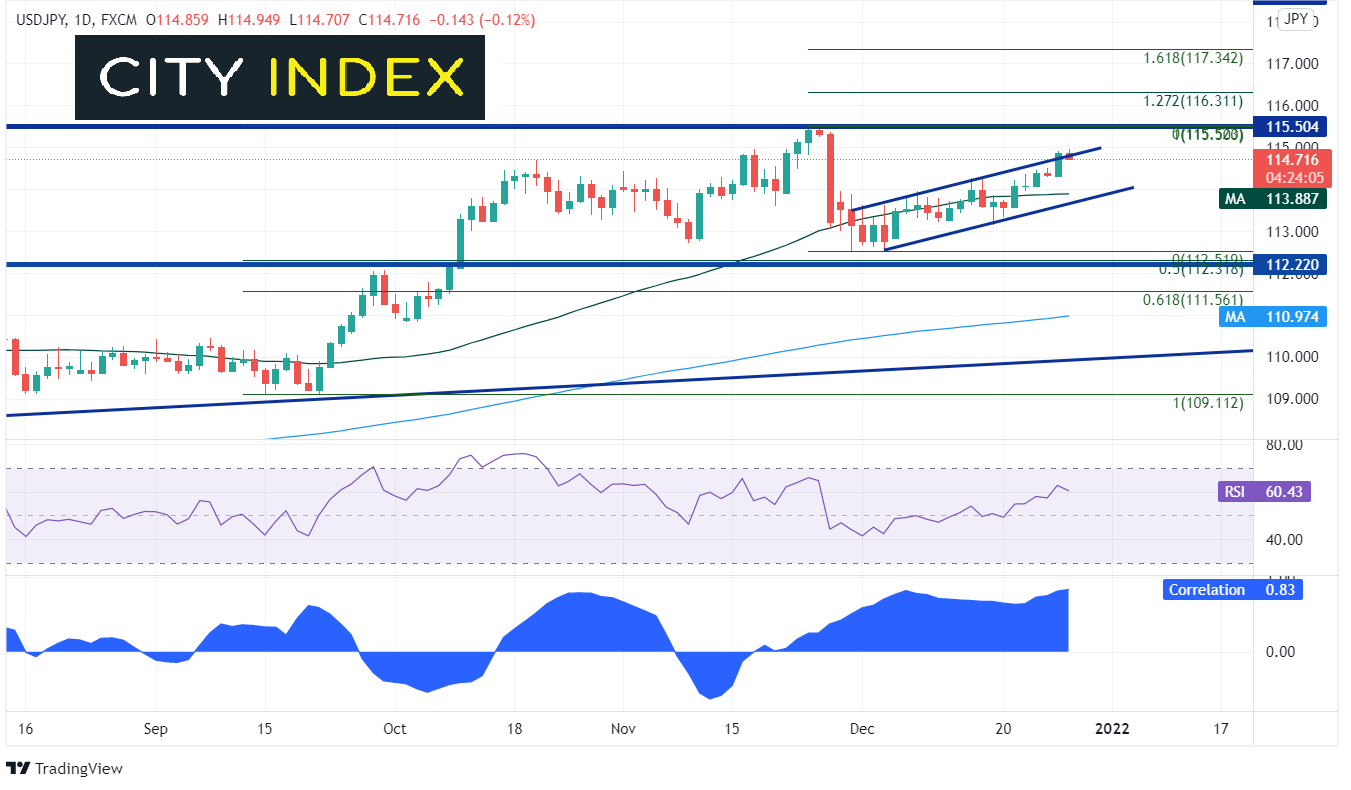
Many times, when we see risk on or risk off, yen pairs typically follow. For example, on December 21st, USD/JPY opened at 113.57. Yesterday the pair closed at 114.86, a rally of 129 pips in 5 days. The pair also closed above the top, upward sloping trendline of the rising channel it has been in since December 1st. Notice at the bottom of the chart that the correlation coefficient between USD/JPY and Emini S&P futures is +0.84. A reading about +0.80 is considered strong positive correlation. Resistance is the at the previous high of 115.52, and then the 127.2% and 161.8% Fibonacci extensions from the highs of November 24th to the lows of December 3rd at 116.31 and 117.34, respectively. Horizontal support is at Monday’s low near 114.31, and then a confluence of support at the 200 Day Moving Average and the bottom trendline of the upward sloping channel at 113.89.

Source: Tradingview, Stone X
Trade USD/JPY now: Login or open a new account!
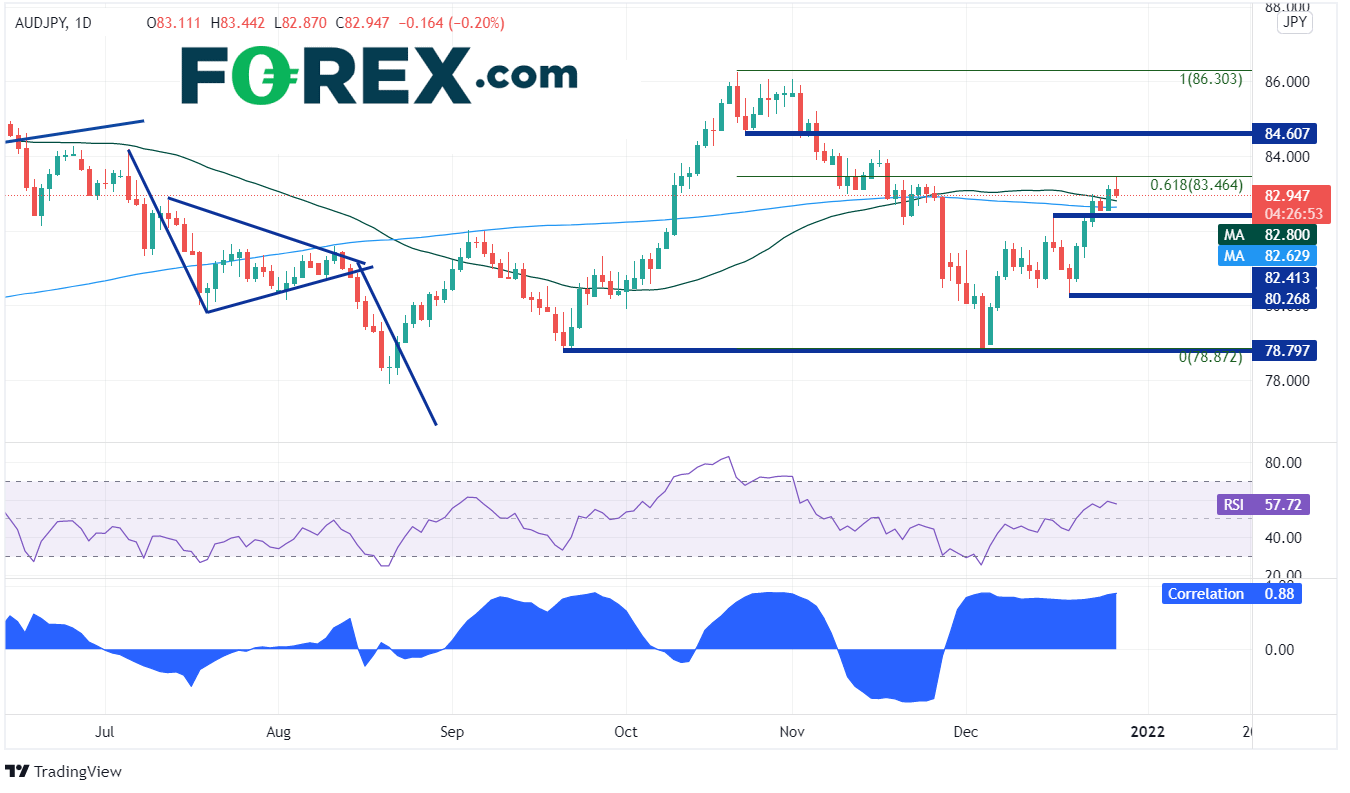
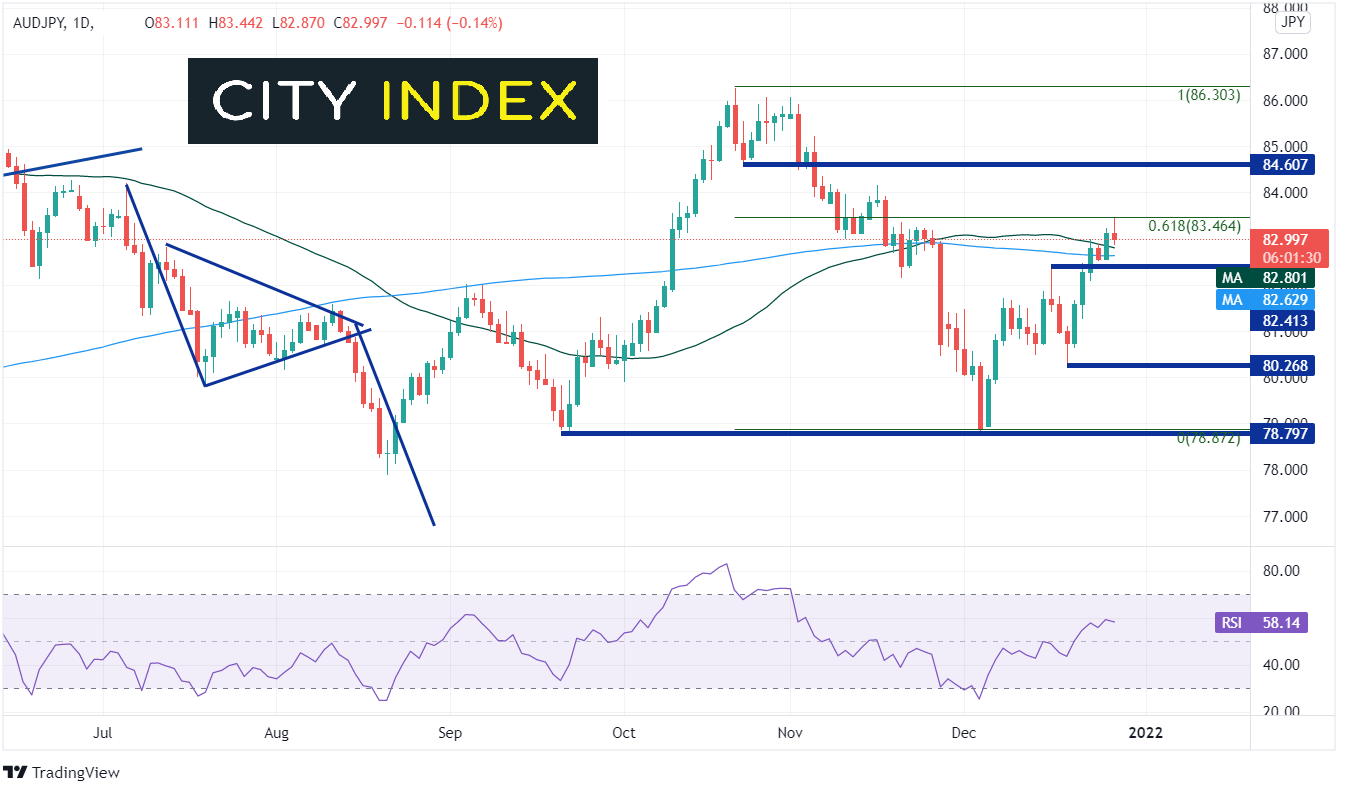
AUD/JPY is another yen pair that will typically the S&P 500. The pair rallied from 80.75 on December 21st to the 61.8% Fibonacci retracement level from the October 21st high to the December 3rd low at 83.46 and stalled. On the move higher, AUD/JPY broke above the 50- and 200- Day Moving Averages at 82.80 and 82.63 respectively. These levels now act as support. Notice at the bottom of the chart that the correlation coefficient between AUD/JPY and Emini S&P futures is +0.88. Again, this is a very strong positive correlation. Resistance is at the previously mentioned 61.8% Fibonacci level of 83.46, then horizontal resistance at 84.60. Horizontal support below the moving averages is at 82.80, then way down at 80.36.
Source: Tradingview, Stone X
Trade AUD/JPY now: Login or open a new account!
The S&P 500 has been viscous the last few days, taking out all shorts in its way. Will the yen pairs move higher if stocks continue to move higher? Based on the daily correlation between the S&P 500 and Yen pairs, it seems likely!
Learn more about forex trading opportunities.
We can talk fundamentals all you want. We can talk technicals until we are blue in the face. The fact of the matter is that the S&P 500 (as shown by Emini Futures to include overnight ranges) have gone one-way over the past 4 trading sessions: up! Santa Clause rally, sure. Year-end rally, why not? Call it whatever you want. But with many major houses finished trading for the year, this leaves an opportunity for those left to push the markets around in size, as volume and liquidity are light. If large pension funds need to get something done, they could move the markets. Indeed, S&P 500 is up nearly 5% over the last 4 trading sessions. There is no indication that the index is ready to let up (barring any surprise news). The RSI is diverging from price in a big way, yet price continued higher over the last 4 days. First resistance is at the top upward sloping trendline near 4840 and then the 161.8% Fibonacci retracement level from the highs of December 16th to the lows of December 20th at 4865.75. First support is at previous highs of 4733.75, then the 50-Day Moving Average at 4635.25.
Source: Tradingview, Stone X
Many times, when we see risk on or risk off, yen pairs typically follow. For example, on December 21st, USD/JPY opened at 113.57. Yesterday the pair closed at 114.86, a rally of 129 pips in 5 days. The pair also closed above the top, upward sloping trendline of the rising channel it has been in since December 1st. Notice at the bottom of the chart that the correlation coefficient between USD/JPY and Emini S&P futures is +0.84. A reading about +0.80 is considered strong positive correlation. Resistance is the at the previous high of 115.52, and then the 127.2% and 161.8% Fibonacci extensions from the highs of November 24th to the lows of December 3rd at 116.31 and 117.34, respectively. Horizontal support is at Monday’s low near 114.31, and then a confluence of support at the 200 Day Moving Average and the bottom trendline of the upward sloping channel at 113.89.
Source: Tradingview, Stone X
Trade USD/JPY now: Login or Open a new account!
• Open an account in the UK
• Open an account in Australia
• Open an account in Singapore
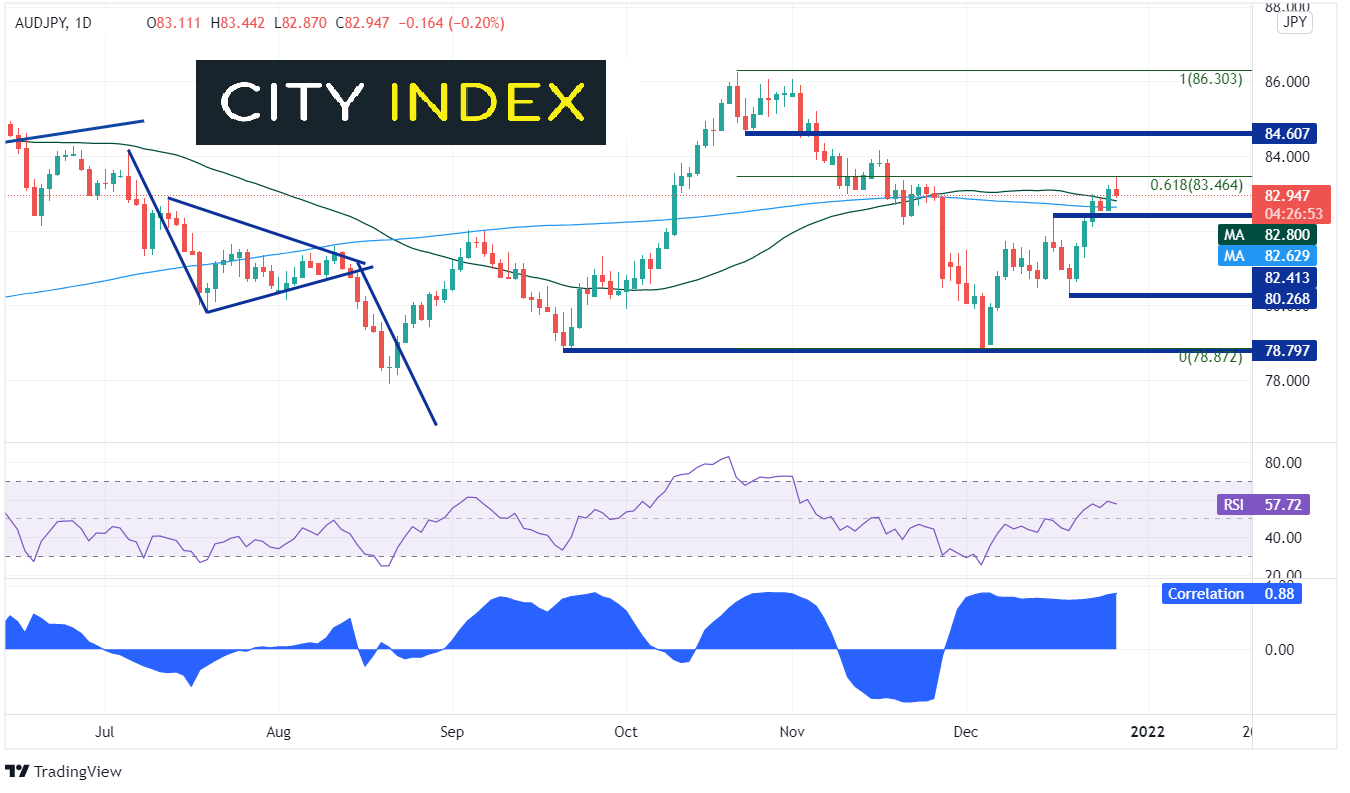
AUD/JPY is another yen pair that will typically the S&P 500. The pair rallied from 80.75 on December 21st to the 61.8% Fibonacci retracement level from the October 21st high to the December 3rd low at 83.46 and stalled. On the move higher, AUD/JPY broke above the 50- and 200- Day Moving Averages at 82.80 and 82.63 respectively. These levels now act as support. Notice at the bottom of the chart that the correlation coefficient between AUD/JPY and Emini S&P futures is +0.88. Again, this is a very strong positive correlation. Resistance is at the previously mentioned 61.8% Fibonacci level of 83.46, then horizontal resistance at 84.60. Horizontal support below the moving averages is at 82.80, then way down at 80.36.
Source: Tradingview, Stone X
Trade AUD/JPY now: Login or Open a new account!
• Open an account in the UK
• Open an account in Australia
• Open an account in Singapore
The S&P 500 has been viscous the last few days, taking out all shorts in its way. Will the yen pairs move higher if stocks continue to move higher? Based on the daily correlation between the S&P 500 and Yen pairs, it seems likely!
Learn more about forex trading opportunities.
Related tags:

The complete CFD trading experience
Award-winning platforms, competitive spreads, low commissions and dedicated support.
We live and breathe the markets and are dedicated to helping traders realise their ambitions as we continue to set the industry bar.
Economic calendar
Web Trader platform
Our sophisticated web-based platform is packed with features.
Related articles

USD/JPY weekly outlook: Quarter turn scrambles rates regime
USD/JPY’s tight relationship with front-end US rates broke down sharply last week, but quarter-turn flows and positioning suggest the disconnect may prove temporary.


USD/CAD forecast: rally could accelerate above June highs at 1.4250
USD/CAD recovered quickly after weaker US jobs data, keeping the bullish trend in focus. A move above the June highs could accelerate the rally as inflation keeps the Fed under pressure.


USD Sets Fresh Yearly High as EUR/USD Drops Dramatically, USD/JPY Stable
Well, it was a week of USD strength that wasn’t entirely pushed by USD/JPY, as a strong sell-off in EUR/USD has pushed the major pair to its most oversold state in a decade.

StoneX Europe Ltd may make third party material available on this website which may contain information included but not limited to the conditions of financial markets. The material is for information purposes only and does not contain, and should not be construed as containing, investment advice and/or investment recommendation and/or an investment research and/or an offer of or solicitation for any transactions in financial instruments; any decision to enter into a specific transaction shall be made by the client following an assessment by him/her of their situation.
StoneX Europe Ltd makes no representation or warranty and assumes no liability as to the accuracy or completeness of the information provided, nor any loss arising from any investment based on a recommendation, forecast or other information supplied. You should always seek independent advice as to your suitability to speculate in any related markets and your ability to assume the associated risks, if you are at all unsure. We are not under any obligation to update any such material. Any opinion made may be personal to the author and may not reflect the opinion of StoneX Europe Ltd.