



Swiss Franc Forecast: USD/CHF Breakout Looms After Four Weeks at Resistance
The rally has repeatedly stalled beneath the same technical ceiling, with USD/CHF once again approaching a pivotal inflection point.
Share this:

Swiss Franc Technical Forecast: USD/CHF Weekly Trade Levels
- USD/CHF has spent four consecutive weeks pressing a major pivot zone at uptrend resistance.
- The repeated failure to break higher is increasing the importance of this technical barrier for the broader uptrend.
- A decisive close above resistance would confirm uptrend resumption and expose the next major upside objectives.
- A break below the monthly range low would be the first indication that bullish momentum is fading and a larger correction may be underway.
- The economic calendar is relatively light, leaving geopolitical developments as the most likely catalyst for the next directional move.
- Resistance 8103, 8200/15 (key), 8333– Support 8037, 8009 (key), 7827/39
USD/CHF is entering a decisive phase after spending nearly a month unable to clear a major technical barrier. Although the January uptrend remains constructive, repeated rejection from the same zone has increased the risk that momentum begins to fade unless buyers force a convincing breakout. With price still holding above rising trend support and geopolitical developments likely to drive sentiment, the next move could determine whether the broader advance resumes or gives way to a deeper correction. Battle lines drawn on the USD/CHF weekly technical chart.
Review my latest Weekly Strategy Webinar for an in-depth breakdown of this USD/CHF setup and more. Join live on Monday’s at 8:30am EST.
Swiss Franc Price Chart – USD/CHF Weekly
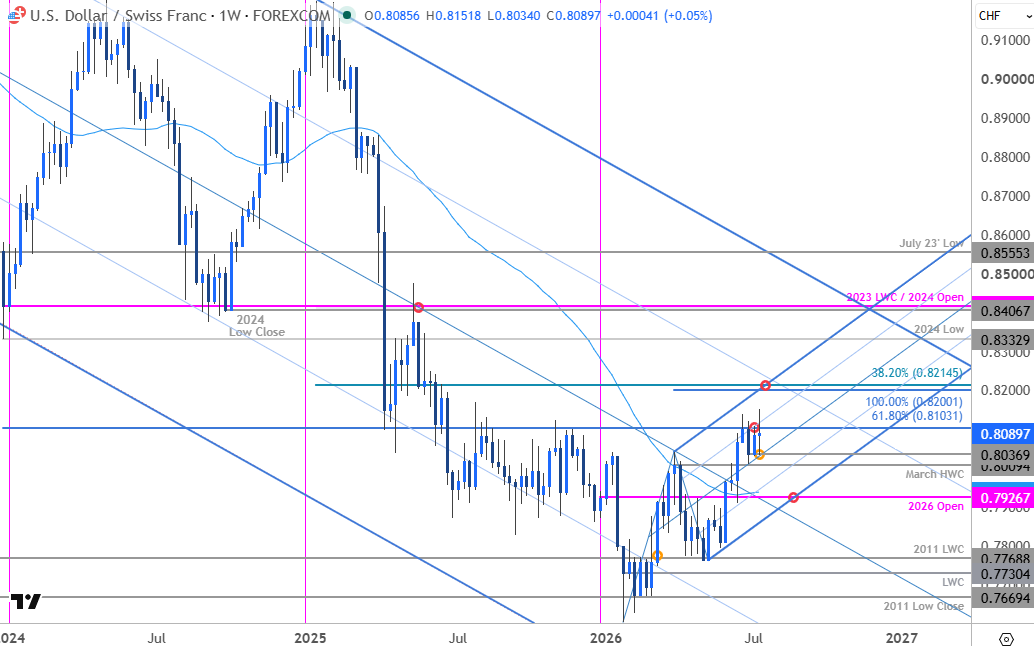
Chart Prepared by Michael Boutros, Sr. Technical Strategist; USD/CHF on TradingView
Technical Outlook: In last month’s Swiss Franc Technical Forecast we noted that USD/CHF was, “testing uptrend resistance at a key pivot zone. From a trading standpoint, a good zone to reduce portions of long-exposure / raise protective stops- losses should be limited to 8009 IF price is heading higher on this stretch with ac close above 8103 needed to fuel the next leg of the advance.” USD/CHF closed at 8100 that week before pulling back with decline registering in intraweek low at 8010 the following week. The subsequent recovery takes USD/CHF back into pivotal resistance of a fourth consecutive week and the focus remains on possible inflection off this zone with the long-bias still vulnerable while below 8103.
Initial weekly support now rests with the monthly close low at 8037- note the median line converges on this level next week. Ultimately, a break below the March high-week close (HWC) at 8009 would be needed to threaten a deeper correction within the January uptrend towards the objective yearly open and the 52-week moving average near 7927/39 (bullish invalidation). Look for a larger reaction there IF reached.
A topside breach / weekly close above the 61.8% extension of the 2022 decline at 8103 is needed to mark uptrend resumption. The next major technical consideration is eyed at the 100% extension of the January advance and the 38.2% retracement of the 2025 decline at 8200/15. Note that the upper parallel converges on this zone over the next few weeks and represents an area of interest for possible topside exhaustion / price inflection IF reached. Strength beyond this threshold is needed to fuel the next major phase of the rally towards the 2024 lows at 8333.

Bottom line: USD/CHF is trading into a pivotal resistance zone for the fourth consecutive week and although the technical outlook remains constructive, the immediate advance remains vulnerable while below. From a trading standpoint, the focus is on a breakout of this range just above the median line- losses would need to be limited to 8009 IF price is heading for a breakout on this stretch with a close above the 75% parallel needed to fuel the next major leg of the rally.
The economic calendar is relatively light next week, leaving developments surrounding the conflict with Iran as the primary catalyst for shifts in market sentiment. Watch the weekly close for guidance here. Review my latest Swiss Franc Short-term Outlook for a closer look at the near-term USD/CHF technical trade levels.
USD/CHF Key Economic Data Releases
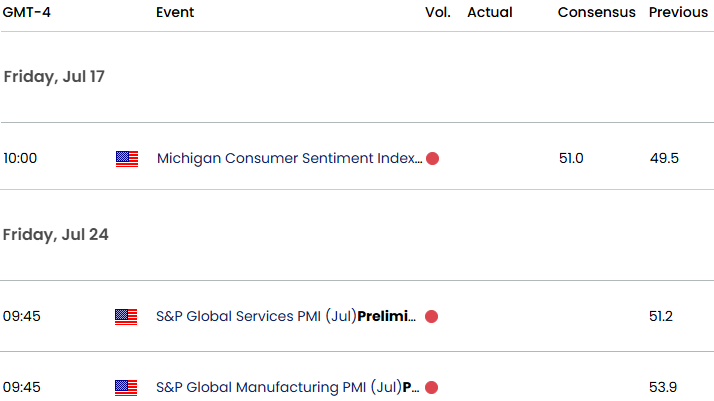
Economic Calendar - latest economic developments and upcoming event risk.
Active Weekly Technical Charts
- Gold (XAU/USD)
- British Pound (GBP/USD)
- Australian Dollar (AUD/USD)
- US Dollar Index (DXY)
- Canadian Dollar (USD/CAD)
- Japanese Yen (USD/JPY)
- Euro (EUR/USD)
- Bitcoin (BTC/USD)
--- Written by Michael Boutros, Senior Technical Strategist
Follow Michael on X @MBForex
Latest market news




The complete CFD trading experience
Award-winning platforms, competitive spreads, low commissions and dedicated support.
We live and breathe the markets and are dedicated to helping traders realise their ambitions as we continue to set the industry bar.
Economic calendar
Web Trader platform
Our sophisticated web-based platform is packed with features.
Related articles
Australian Dollar Forecast: AUD/USD Support Reversal Sparks Monthly Range Breakout 10 23 2026
A sharp reversal off key support has fueled the AUD/USD recovery, with resistance now in focus ahead of next week’s Fed decision and Australian CPI.
Crude Oil Forecast: Weekend Iran Strike Fears Lift Oil Toward War Highs
Brent crude oil is accelerating above $110 as traders price in the risk of a US-Israeli strike on Iran over the weekend. How much more of a geopolitical premium can oil build in before the close?


Brent WTI Spread Hits 11-Year Wall and RSI Hits 2011 Highs
The Brent WTI spread is testing resistance that has held for about 11 years, with monthly RSI at overbought levels last seen in 2011.

StoneX Europe Ltd may make third party material available on this website which may contain information included but not limited to the conditions of financial markets. The material is for information purposes only and does not contain, and should not be construed as containing, investment advice and/or investment recommendation and/or an investment research and/or an offer of or solicitation for any transactions in financial instruments; any decision to enter into a specific transaction shall be made by the client following an assessment by him/her of their situation.
StoneX Europe Ltd makes no representation or warranty and assumes no liability as to the accuracy or completeness of the information provided, nor any loss arising from any investment based on a recommendation, forecast or other information supplied. You should always seek independent advice as to your suitability to speculate in any related markets and your ability to assume the associated risks, if you are at all unsure. We are not under any obligation to update any such material. Any opinion made may be personal to the author and may not reflect the opinion of StoneX Europe Ltd.