









Tariff Tantrum: SPX, Gold, USD, EUR/USD, USD/JPY
It’s been an eventful past week and we’re still not out of the woods. This webinar looked at a wide range of markets across stocks, gold and FX pairs.
Share this:

US Dollar Price Action Setups Talking Points:
- This is a recap of today’s price action webinar looking across macro markets.
- A central theme on today’s webinar was the pointlessness of prediction, and instead, trying to use price action to find asymmetric risk-reward opportunities across markets. This is related to trying to avoid chasing moves and, instead, waiting for pullbacks like we’ve seen in equities so far this week. This is the logic of what I teach in the Trader’s Course.
- To ask questions in the live webinar you’re welcome to register and the following link will allow for that to happen: Click here for registration information.
While markets remain on edge the ‘Black Monday’ that many had predicted hasn’t yet taken place. To be sure matters can change fast as we’ve seen a large push of volatility, which means the range of possible scenarios has also increased. But the fact of the matter is that no person knows exactly what will happen next, and as traders, we should keep that uncertainty front of mind at all points in time.
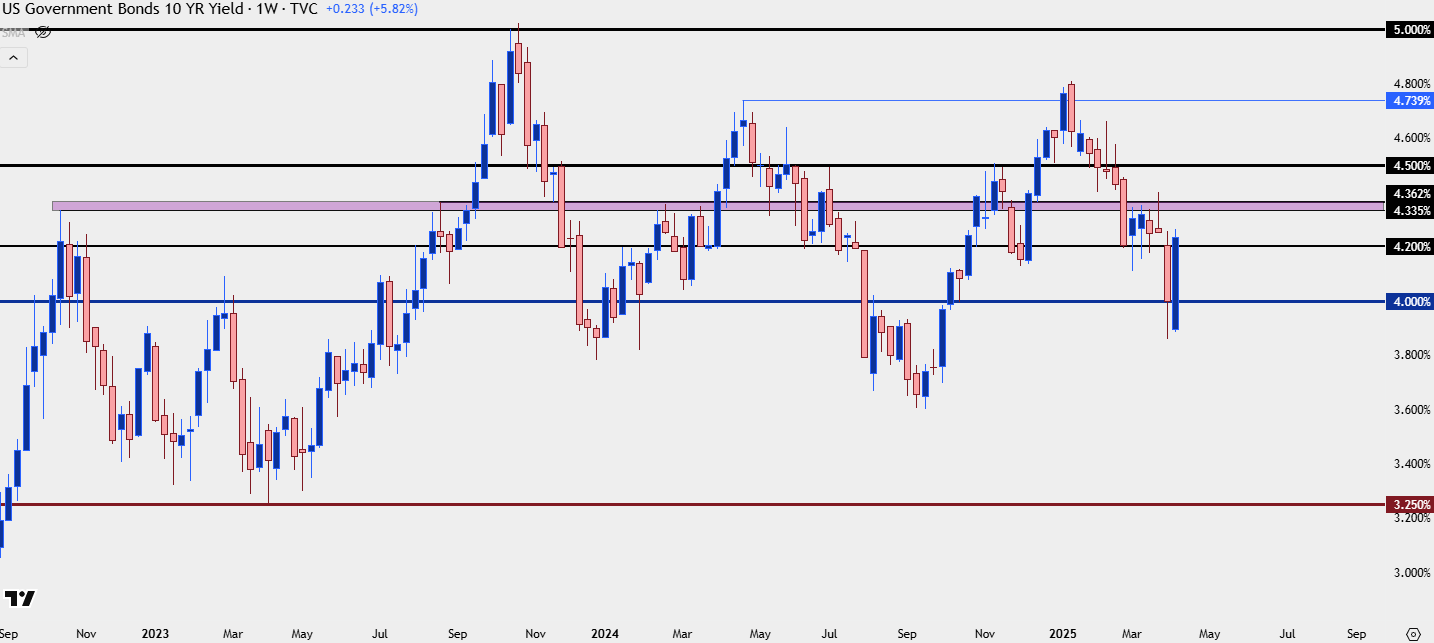
Interestingly U.S. Treasury yields are up today and up on net from last week, with the 10-year hitting above 4.2%. Given that this is the likely focal point of the administration, with more than $9 trillion in Treasury debt coming due later this year, there can be an attractive venue on the long side of bonds, which can act as a deterrent to equity gains. As I said in the webinar, until the 10-year gets down to around 3% or so I think this could be a factor of importance. But, with that said, it doesn’t mean that equities have to melt down in a manner similar to what showed last Thursday and Friday.
U.S. 10-Year Treasury Yields – Weekly Chart
Equities – SPX
If you are a bear on stocks, selling at this week’s open made for a difficult prospect. RSI had pushed to oversold on the weekly for the first time since 2020 and oversold on the daily for the first time since 2022, around when stocks had bottomed. Yesterday showed a rally that continued through early trade today, and now we’re seeing a bit of pressure as bears have responded by selling the pullback.
The bullish gap that I had looked at in the webinar has been filled since the above video was recorded, so the question now is whether buyers come into hold a higher-low as the 5k level remains important as a possible point of support.
SPX 30-Minute Chart
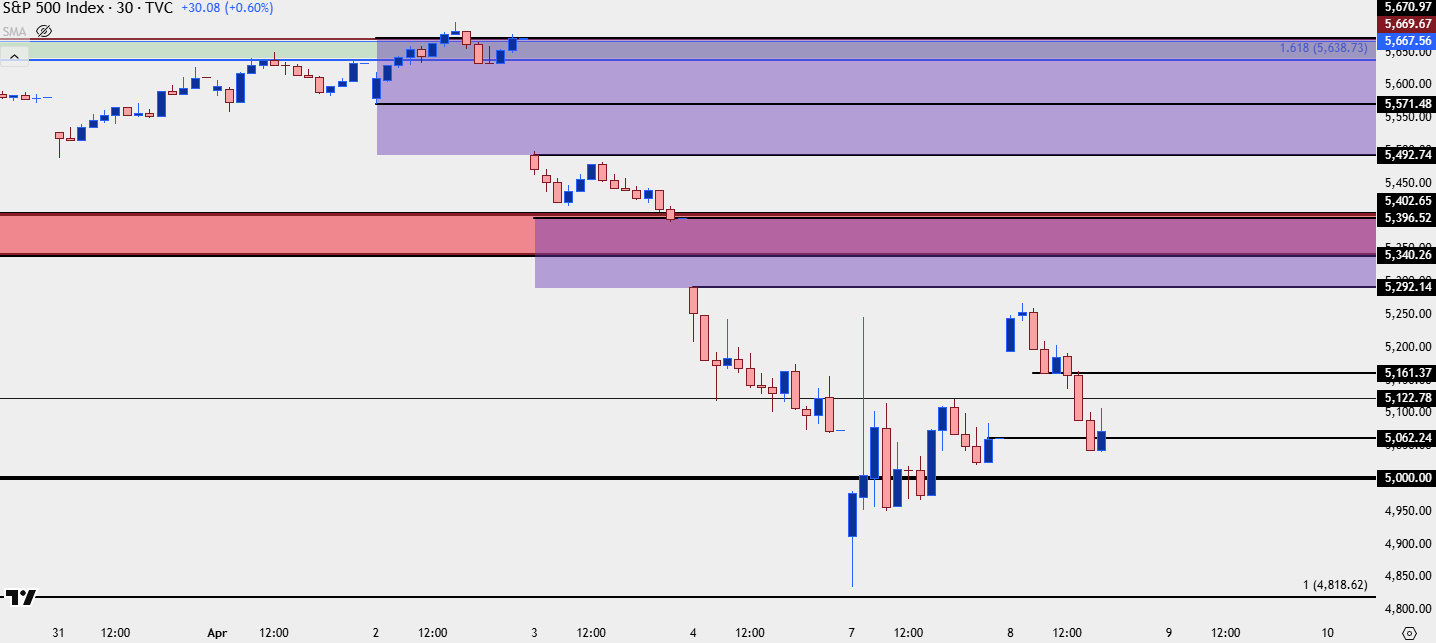 Chart prepared by James Stanley; data derived from Tradingview
Gold
Gold looks like it could work a deeper pullback as the 2950-2956 support test constitutes a lower-low, and so far the re-test back-above 3k has struggled. As I said in the webinar, the door now opens for deeper retracement potential, and 2950-2956 is the spot that bulls need to defend to keep the upside trend in order. Or else the next major spot of support is the zone that held the highs in Q4 of last year, from around 2790-2800.
Gold Four-Hour Price Chart
 Chart prepared by James Stanley; data derived from Tradingview
USD
The U.S. Dollar has been somewhat messy through the entire tariff theme. Initially the currency sold off quickly on Thursday, but Friday saw an inside bar develop and yesterday saw bulls pushing a bit higher, starting to fill the gap from last Wednesday/Thursday.
At this point, there’s a short-term ascending triangle that’s still in the mix and that gap from last week runs all the way up to 103.70. There’s more resistance overhead, around 104.35 and then the 200-day moving average around 104.85; but as usual I want to try to find markets accommodative on both sides. In this webinar, I was looking to USD/JPY for USD-strength scenarios and EUR/USD for USD-weakness, expanded upon below.
U.S. Dollar (DXY) Hourly Chart
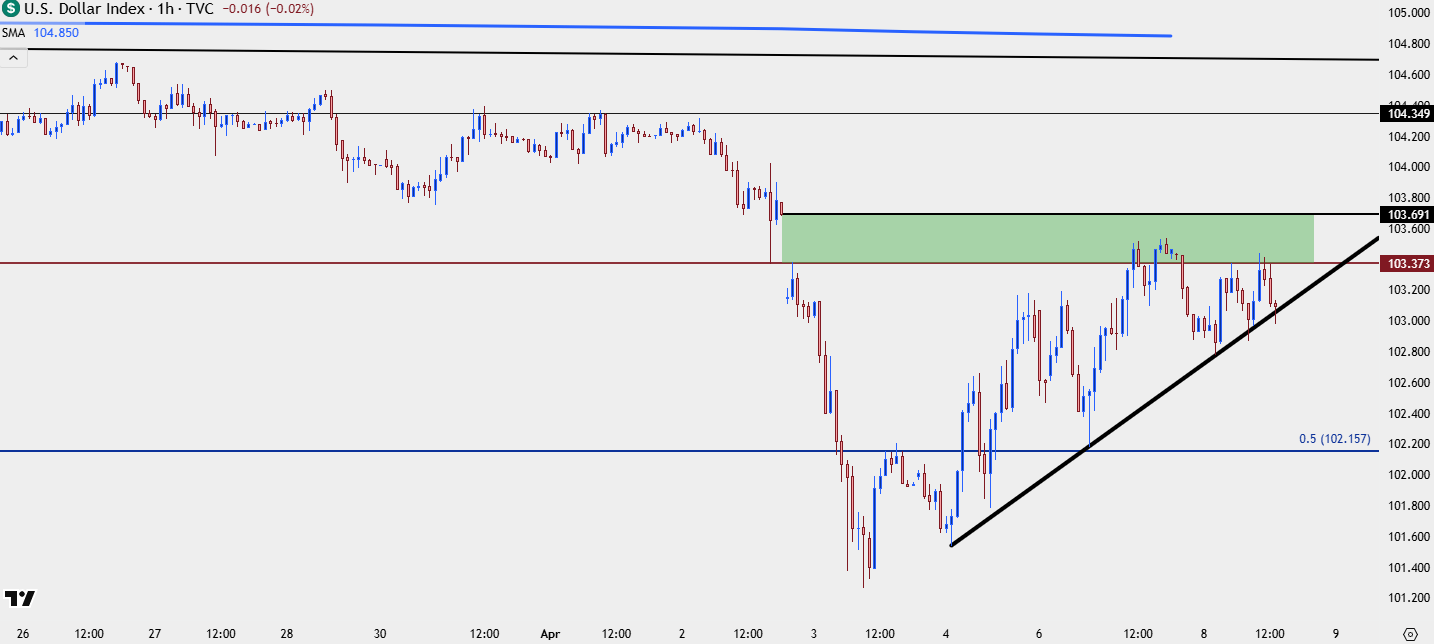 Chart prepared by James Stanley; data derived from Tradingview
USD/JPY
In the initial aftermath of the tariff announcement USD/JPY was not looking good as sellers were hitting it consistently. But – the 145.00 level came into play on Friday morning and suddenly sellers were stalled and unable to continue the move. That 145.00 support held again at this week’s open, and led to a decent bounce yesterday until resistance came into play at 148.00.
If we do see USD-strength prevail then upside in USD/JPY could remain attractive. But, as shared in the webinar, if USD-weakness pulls this below 145.00 and causes a larger reversal, there could be legitimate fear spanning across equities as a greater show of the carry trade unwinding could drive a global de-leveraging event.
USD/JPY Weekly Price Chart
 Chart prepared by James Stanley; data derived from Tradingview
EUR/USD
For USD-weakness, I’m tracking EUR/USD following the pairs 1.1000 breakout last week. While it couldn’t hold above the big figure, there remains context for support given the prior rally off of the 200-day moving average. The 1.0943 Fibonacci level remains key, and if we do see bulls hold a higher-low on the daily chart (above Monday’s low) the door could soon open for another test of the 1.1000 handle. And if there is a backdrop of USD-breakdowns, the 1.1200 level becomes a longer-term spot of interest for the pair after it held resistance on multiple occasions there last year.
EUR/USD Daily Chart
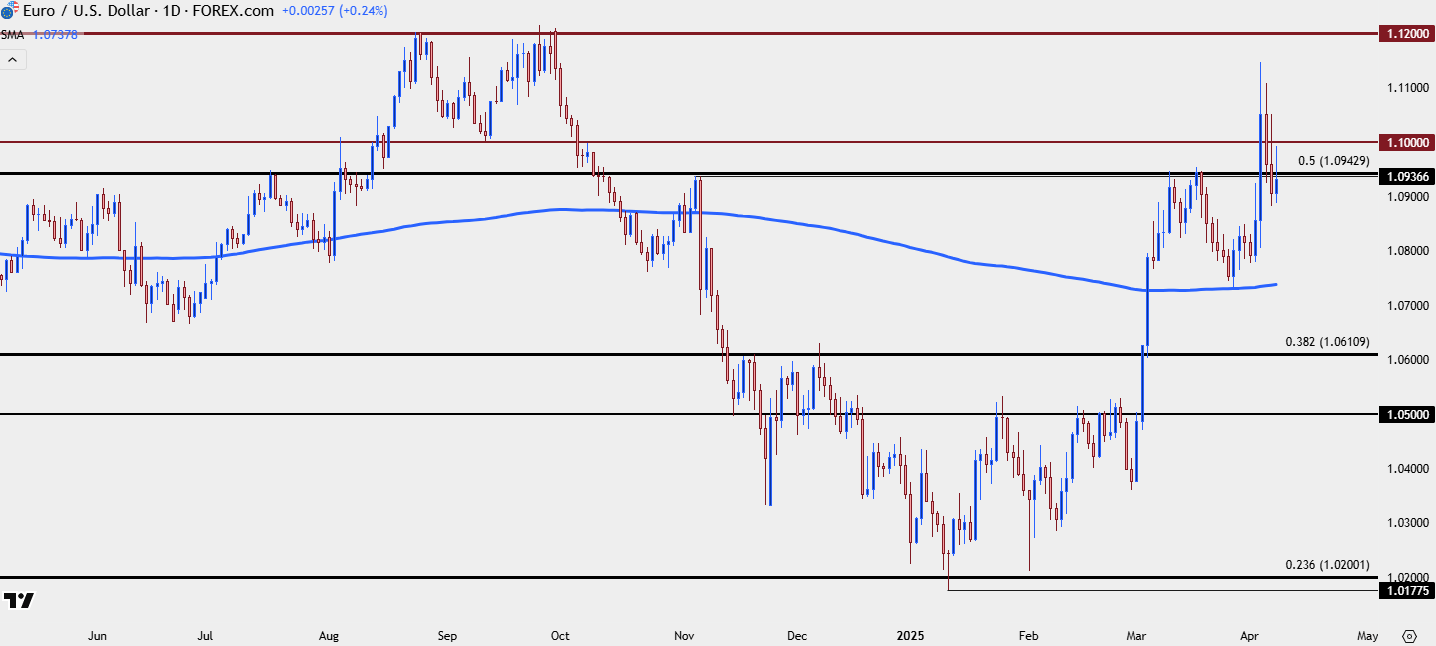
Chart prepared by James Stanley; data derived from Tradingview
--- written by James Stanley, Senior Strategist
US Dollar Price Action Setups Talking Points:
- This is a recap of today’s price action webinar looking across macro markets.
- A central theme on today’s webinar was the pointlessness of prediction, and instead, trying to use price action to find asymmetric risk-reward opportunities across markets. This is related to trying to avoid chasing moves and, instead, waiting for pullbacks like we’ve seen in equities so far this week. This is the logic of what I teach in the Trader’s Course.
- To ask questions in the live webinar you’re welcome to register and the following link will allow for that to happen: Click here for registration information.
While markets remain on edge the ‘Black Monday’ that many had predicted hasn’t yet taken place. To be sure matters can change fast as we’ve seen a large push of volatility, which means the range of possible scenarios has also increased. But the fact of the matter is that no person knows exactly what will happen next, and as traders, we should keep that uncertainty front of mind at all points in time.
Interestingly U.S. Treasury yields are up today and up on net from last week, with the 10-year hitting above 4.2%. Given that this is the likely focal point of the administration, with more than $9 trillion in Treasury debt coming due later this year, there can be an attractive venue on the long side of bonds, which can act as a deterrent to equity gains. As I said in the webinar, until the 10-year gets down to around 3% or so I think this could be a factor of importance. But, with that said, it doesn’t mean that equities have to melt down in a manner similar to what showed last Thursday and Friday.
U.S. 10-Year Treasury Yields – Weekly Chart
Equities – SPX
If you are a bear on stocks, selling at this week’s open made for a difficult prospect. RSI had pushed to oversold on the weekly for the first time since 2020 and oversold on the daily for the first time since 2022, around when stocks had bottomed. Yesterday showed a rally that continued through early trade today, and now we’re seeing a bit of pressure as bears have responded by selling the pullback.
The bullish gap that I had looked at in the webinar has been filled since the above video was recorded, so the question now is whether buyers come into hold a higher-low as the 5k level remains important as a possible point of support.
SPX 30-Minute Chart
Chart prepared by James Stanley; data derived from Tradingview
Gold
Gold looks like it could work a deeper pullback as the 2950-2956 support test constitutes a lower-low, and so far the re-test back-above 3k has struggled. As I said in the webinar, the door now opens for deeper retracement potential, and 2950-2956 is the spot that bulls need to defend to keep the upside trend in order. Or else the next major spot of support is the zone that held the highs in Q4 of last year, from around 2790-2800.
Gold Four-Hour Price Chart
Chart prepared by James Stanley; data derived from Tradingview
USD
The U.S. Dollar has been somewhat messy through the entire tariff theme. Initially the currency sold off quickly on Thursday, but Friday saw an inside bar develop and yesterday saw bulls pushing a bit higher, starting to fill the gap from last Wednesday/Thursday.
At this point, there’s a short-term ascending triangle that’s still in the mix and that gap from last week runs all the way up to 103.70. There’s more resistance overhead, around 104.35 and then the 200-day moving average around 104.85; but as usual I want to try to find markets accommodative on both sides. In this webinar, I was looking to USD/JPY for USD-strength scenarios and EUR/USD for USD-weakness, expanded upon below.
U.S. Dollar (DXY) Hourly Chart
Chart prepared by James Stanley; data derived from Tradingview
USD/JPY
In the initial aftermath of the tariff announcement USD/JPY was not looking good as sellers were hitting it consistently. But – the 145.00 level came into play on Friday morning and suddenly sellers were stalled and unable to continue the move. That 145.00 support held again at this week’s open, and led to a decent bounce yesterday until resistance came into play at 148.00.
If we do see USD-strength prevail then upside in USD/JPY could remain attractive. But, as shared in the webinar, if USD-weakness pulls this below 145.00 and causes a larger reversal, there could be legitimate fear spanning across equities as a greater show of the carry trade unwinding could drive a global de-leveraging event.
USD/JPY Weekly Price Chart
Chart prepared by James Stanley; data derived from Tradingview
EUR/USD
For USD-weakness, I’m tracking EUR/USD following the pairs 1.1000 breakout last week. While it couldn’t hold above the big figure, there remains context for support given the prior rally off of the 200-day moving average. The 1.0943 Fibonacci level remains key, and if we do see bulls hold a higher-low on the daily chart (above Monday’s low) the door could soon open for another test of the 1.1000 handle. And if there is a backdrop of USD-breakdowns, the 1.1200 level becomes a longer-term spot of interest for the pair after it held resistance on multiple occasions there last year.
EUR/USD Daily Chart
Chart prepared by James Stanley; data derived from Tradingview
--- written by James Stanley, Senior Strategist


The complete CFD trading experience
Award-winning platforms, competitive spreads, low commissions and dedicated support.
We live and breathe the markets and are dedicated to helping traders realise their ambitions as we continue to set the industry bar.
Economic calendar
Web Trader platform
Our sophisticated web-based platform is packed with features.
Related articles
AUD/USD Bulls Fight Back After Australian Jobs Shock
AUD/USD has been hit by another ugly Australian employment report, sending RBA rate hike expectations sharply lower. Yet the relationships driving the currency have shifted since quarter-end, and improving risk appetite could provide the fuel for a recovery.

S&P 500 Another Thursday Bounce After CPI-Fueled Sell-Off
Carnage may be overstating it a bit given that fresh ATHs were printed just a week ago but if you were reading the headlines, it would certainly seem to be more than just a -2.28% pullback from the high.

Gold Price Short-term Outlook: XAU/USD Holds Critical Support as Breakout Nears 10 15 2026
Gold is consolidating after a steep selloff, with momentum divergence raising the stakes for the next move ahead of the Fed decision.

StoneX Europe Ltd may make third party material available on this website which may contain information included but not limited to the conditions of financial markets. The material is for information purposes only and does not contain, and should not be construed as containing, investment advice and/or investment recommendation and/or an investment research and/or an offer of or solicitation for any transactions in financial instruments; any decision to enter into a specific transaction shall be made by the client following an assessment by him/her of their situation.
StoneX Europe Ltd makes no representation or warranty and assumes no liability as to the accuracy or completeness of the information provided, nor any loss arising from any investment based on a recommendation, forecast or other information supplied. You should always seek independent advice as to your suitability to speculate in any related markets and your ability to assume the associated risks, if you are at all unsure. We are not under any obligation to update any such material. Any opinion made may be personal to the author and may not reflect the opinion of StoneX Europe Ltd.