




The ASX 200 jumps out of the gate, but can it make the next hurdle?
The ASX has been swept higher with Wall Street’s short-covering rally and snapped its 5-day decline. But does that make it a bullish move?
Share this:

The ASX 200 has risen around 1.7% at the time of writing after US indices rallied despite the stronger than expected inflation report from the US. Energy stocks have taken the lead with the sector rising 3.8% as they track oil prices higher, and all 11 ASX sectors have posted gains for the day so far. We can’t help but be a little suspicious of the rally, given it is likely fuelled by Wall Street’s short covering. But markets never move in a straight line and must move counter to their own trends once in a while, which leaves the potential for some further upside – at least over the near-term.
ASX 200 weekly chart:
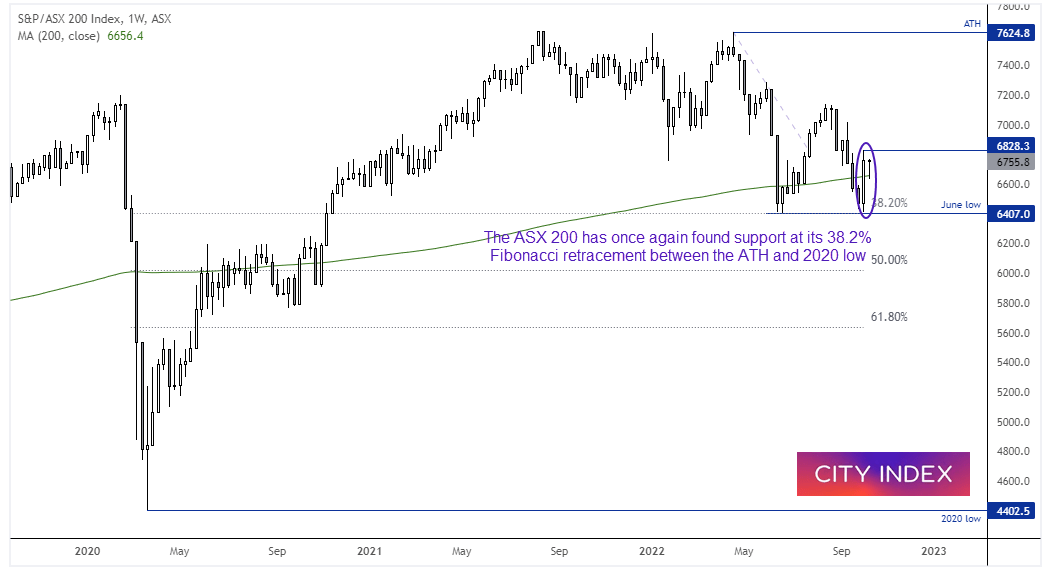

We can see on the weekly chart that ASX 200’s decline from 7324.8 ha once again found support at the 38.2% Fibonacci ratio between the 2020 low and ATH (al-time high). A bullish engulfing candle formed last week which closed above its 200-week MA, and that same MA provided support earlier this week. It was also one of the few major indices to hold above its June low (unlike Wall Street), which made it a prime candidate for a bounce should bearish sentiment east. The question now is whether it can break above the October high of 6828.3.
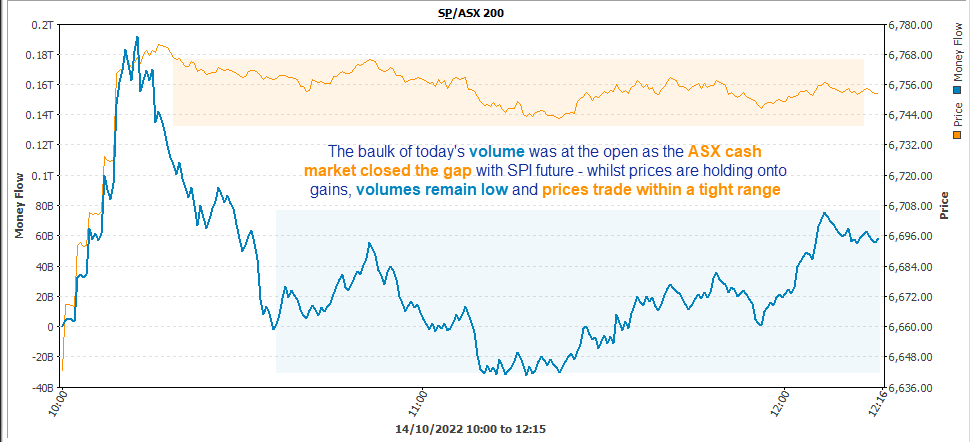
ASX trading volumes are on the ow side today (so far):
The baulk of the day’s volume has been in the first 15 minutes of trade, where the index leapt higher to close its gap with the SPI 200. Sure, it’s holding on to those gains – but at the same time buying has slowed to a trickle as the index trades within a tight range on relatively low volumes. I’m not betting on an imminent break of the October high just yet, especially when it seemingly down to traders ‘selling the rumour and buying the fact’ after another hotter-than-liked inflation print from the US.
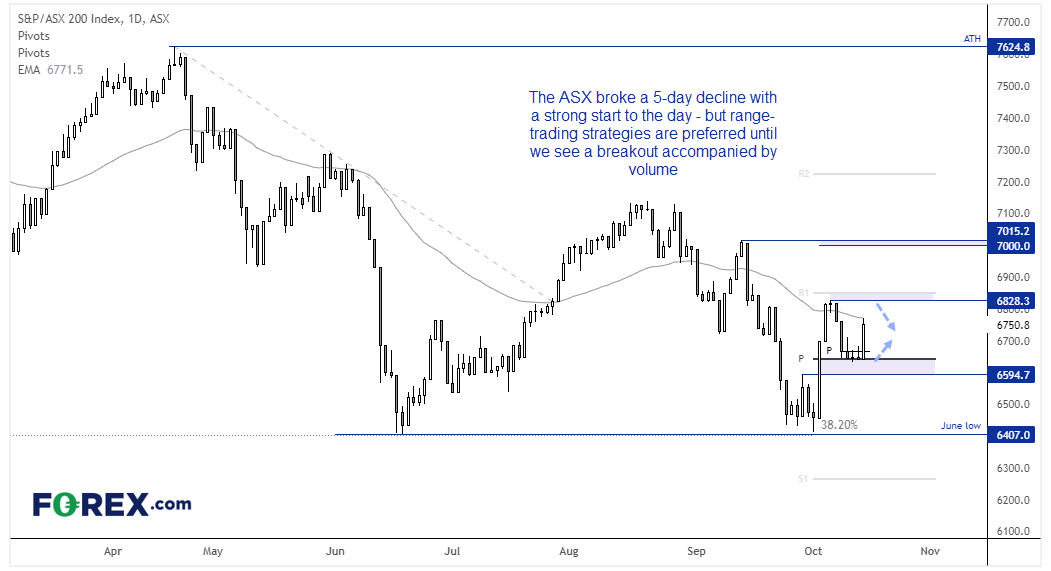
ASX 200 daily chart:
Support has been found around the weekly and monthly pivot points, although the 50-day EMA has capped as resistance today. Due to the lower trading volumes for today’s rally and the fact it has been driven by Wall Street’s short-covering rally, range-trading strategies are preferred between the approximate 6600 – 6530 range.

How to trade with City Index
You can easily trade with City Index by using these four easy steps:
- Open an account, or log in if you’re already a customer
• Open an account in the UK
• Open an account in Australia
• Open an account in Singapore
- Search for the company you want to trade in our award-winning platform
- Choose your position and size, and your stop and limit levels
- Place the trade
How to trade with FOREX.com
Follow these easy steps to start trading with FOREX.com today:
- Open a Forex.com account, or log in if you’re already a customer.
- Search for the pair you want to trade in our award-winning platform.
- Choose your position and size, and your stop and limit levels.
- Place the trade.
Related tags:



The complete CFD trading experience
Award-winning platforms, competitive spreads, low commissions and dedicated support.
We live and breathe the markets and are dedicated to helping traders realise their ambitions as we continue to set the industry bar.
Economic calendar
Web Trader platform
Our sophisticated web-based platform is packed with features.
Related articles

USD/CAD forecast: rally could accelerate above June highs at 1.4250
USD/CAD recovered quickly after weaker US jobs data, keeping the bullish trend in focus. A move above the June highs could accelerate the rally as inflation keeps the Fed under pressure.


Dow Jones Slide Shows What Rate Hike Bets Mean for Stocks
The Dow Jones support breakdown shows rising bond yields and rate hike bets hitting U.S. stocks while tech giants prop up the Nasdaq.

EUR/USD forecast remains tilted lower with French bond troubles ahead of US jobs report
The EUR/USD has tagged a fresh year-to-date low as French public-finance concerns trigger a government bond sell-off. Today's US jobs report may change little, with resilient activity, elevated energy prices and hawkish Fed bets keeping the greenback supported. With the pair trapped below resistance at 1.1410, the risk to the near-term EUR/USD forecast is tilted to the downside.
StoneX Europe Ltd may make third party material available on this website which may contain information included but not limited to the conditions of financial markets. The material is for information purposes only and does not contain, and should not be construed as containing, investment advice and/or investment recommendation and/or an investment research and/or an offer of or solicitation for any transactions in financial instruments; any decision to enter into a specific transaction shall be made by the client following an assessment by him/her of their situation.
StoneX Europe Ltd makes no representation or warranty and assumes no liability as to the accuracy or completeness of the information provided, nor any loss arising from any investment based on a recommendation, forecast or other information supplied. You should always seek independent advice as to your suitability to speculate in any related markets and your ability to assume the associated risks, if you are at all unsure. We are not under any obligation to update any such material. Any opinion made may be personal to the author and may not reflect the opinion of StoneX Europe Ltd.