



The Dow could appeal to bullish (or contrarian) swing traders
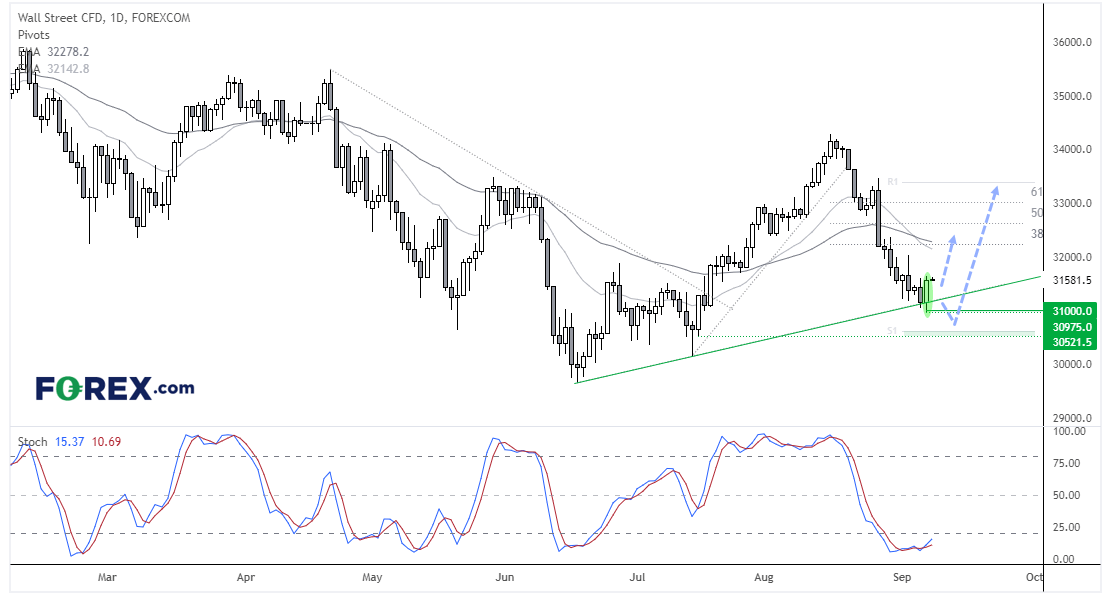
Price action on the DJI (Dow Jones Industrial) and several other markets have flagged the potential for a contrarian setup (favourable for bulls).
Share this:

This image will only appear on cityindex websites!
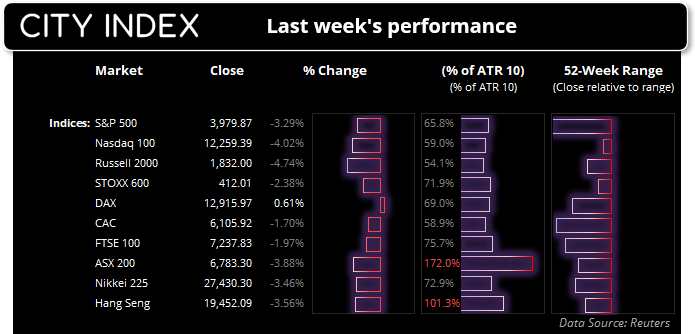
I suspect we’re at or fast approaching an inflection point for several markets – at least over the near-term. USD/CNH rose to within a cats whisker of 7.000 before reversing and Bitcoin bounced form a key support level. We also saw Wall Street rise around 2% whilst yields chilled out for once. When you see multiple markets reverse at or around support or resistance levels in tandem, it usually means something – regardless of whether fundamentals justify it or not. And that leaves the potential for a bounce of US equities, given its relatively deep pullback.
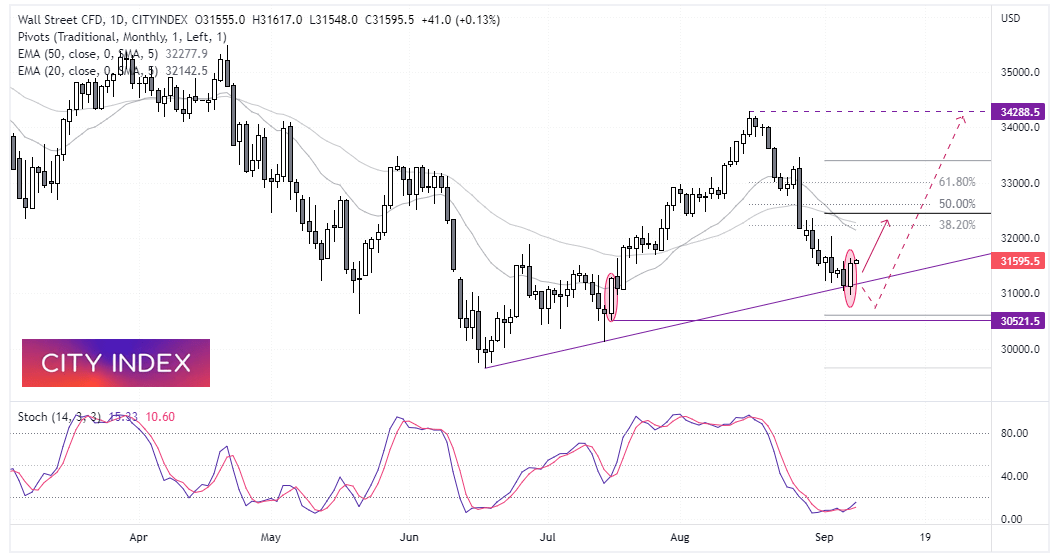
The Dow Jones has seen a relatively deep pullback against the rally from the June low, and there has been two false breaks of trend support over the past two sessions. Furthermore, a bullish engulfing candle formed yesterday which shows demand just above 3100. The stochastic oscillator is also oversold, although yet to general a traditional 'buy signal' by crossing back above 30.
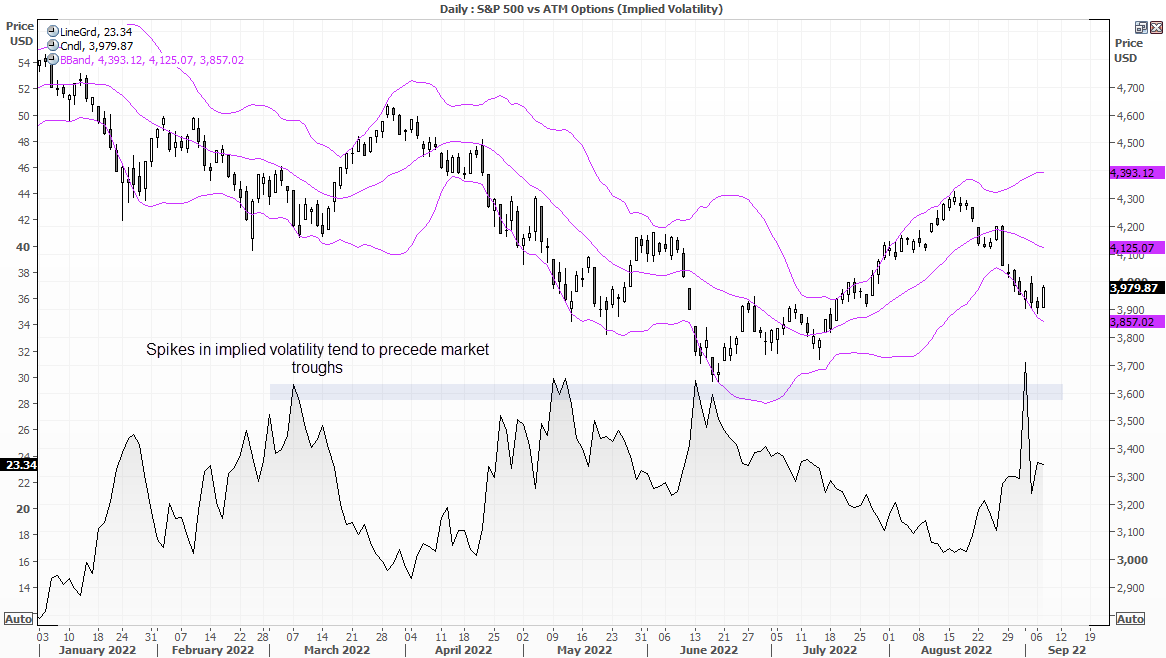
A rise in implied volatility can precede market troughs
The analysis on the DJI can be applied to the S&P500, where the obvious difference would be the key levels. But another piece for the bullish puzzle can be seen on implied volatility, which we have compared with the S&P 500.
Each time the ATM (at the money) options for the S&P 50 have risen to the 28-30 area it roughly coincided with a cycle low. It is not an excellent timing tool, but generally occurs ahead of the low – without giving a precise indication of how far ahead the low may be. But the recent spike is the most aggressive on the chart and, like the Dow, the S&P 500 is showing signs of a potential trough. Moreover, it also trades near the lower Bollinger Band. And, if we want to think bigger and bolder, wave 2's tend to be the deepest - and bullish rallies generally begin during times of uncertainty. Against that backdrop the Dow Jones (and US indices in general) become contrarian candidates for bulls.
As for the Dow there are two potentially bullish scenarios to consider, depending on anticipated time horizon and appetite for volatility.
1 - For near-term longs: We'd like to see prices hold above yesterday's low and continue higher towards 3200 - 3250, before reassessing its upside potential. This approach requires a tighter stop and we're looking for a momentum / swing trade higher (sooner than later).
2 - For a 'longer-term' bullish setups: Perhaps the low is not yet but it is close. Instead, we see a volatile shakeout around current levels before a bullish move unfolds. In which case we'd want prices to remain above the 30,500 area (near a bullish engulfing candle from July) with a view for it to eventually break above the March high. This scenario allows for a wider stop and requires more patience.
Eyes on Jerome Powell
However, with Jerome Powell speaking later today then we need to consider the alternative; he comes out swinging his hawkish bat and sends equities into a tailspin. But even then we need to consider where equities trade in relation to how anticipated such an event is. For example, if this was completely unexpected and equities traded at record highs then we could expect a larger (bearish) reaction. So if Powell hammers hope a 75pb hike (with more to follow) then perhaps we’ll see another leg lower, but remains debatable as to whether it will see it break to new cycle lows.
How to trade with City Index
You can easily trade with City Index by using these four easy steps:
- Open an account, or log in if you’re already a customer
• Open an account in the UK
• Open an account in Australia
• Open an account in Singapore
- Search for the company you want to trade in our award-winning platform
- Choose your position and size, and your stop and limit levels
- Place the trade
How to trade with FOREX.com
Follow these easy steps to start trading with FOREX.com today:
- Open a Forex.com account, or log in if you’re already a customer.
- Search for the pair you want to trade in our award-winning platform.
- Choose your position and size, and your stop and limit levels.
- Place the trade.
Related tags:
Latest market news




The complete CFD trading experience
Award-winning platforms, competitive spreads, low commissions and dedicated support.
We live and breathe the markets and are dedicated to helping traders realise their ambitions as we continue to set the industry bar.
Economic calendar
Web Trader platform
Our sophisticated web-based platform is packed with features.
Related articles
Australian Dollar Short-term Outlook: AUD/USD 3% Plunge Puts Multi-Month Range at Risk 11 6 2026
A sharp equity-led selloff has driven AUD/USD toward critical June-low support, with strong NFP data adding pressure ahead of next week’s U.S. CPI.

Nasdaq 100 forecast: Tech stocks rebound but AI concerns linger
The Nasdaq 100 rebound has run into former support as fears over AI regulation and spending linger. Fawad Razaqzada explains why he maintains a cautious forecast and where the key levels sit.

Dollar forecast: NFP provides dollar, already supported amid tech sell-off, additional boost
The US dollar has found some mild amid the tech rout in recent days, most visibly against risk sensitive and commodity dollars. Today, we have so far seen a bit of a recovery in global indices from their overnight lows. Investors will be watching the markets to see whether fresh losses will be on the again once Wall Street gets going. Ahead of that, we have just seen the release of the October US non-farm payrolls report – and it was much stronger at 165K than expected.
StoneX Europe Ltd may make third party material available on this website which may contain information included but not limited to the conditions of financial markets. The material is for information purposes only and does not contain, and should not be construed as containing, investment advice and/or investment recommendation and/or an investment research and/or an offer of or solicitation for any transactions in financial instruments; any decision to enter into a specific transaction shall be made by the client following an assessment by him/her of their situation.
StoneX Europe Ltd makes no representation or warranty and assumes no liability as to the accuracy or completeness of the information provided, nor any loss arising from any investment based on a recommendation, forecast or other information supplied. You should always seek independent advice as to your suitability to speculate in any related markets and your ability to assume the associated risks, if you are at all unsure. We are not under any obligation to update any such material. Any opinion made may be personal to the author and may not reflect the opinion of StoneX Europe Ltd.