



The Nasdaq-to-Bitcoin Correlation Is Alive and Well (During Risk-Off)
Bitcoin’s correlation with Wall Street may have weakened, but its reaction to Nasdaq sell-offs shows the risk-off link is still very much alive.
Share this:
For years, Bitcoin has been treated as a high-beta risk asset — one that thrives when Wall Street rallies and stumbles when risk appetite fades. Recently, however, that long-standing correlation has broken down. Despite US indices hovering near record highs, Bitcoin has decoupled on the upside while still tumbling during risk-off phases. This asymmetric response suggests that while the bullish correlation may have faded, the bearish one remains intact — a dynamic Bitcoin traders cannot afford to ignore.
View related analysis:
View related analysis:
Bitcoin Correlations with Wall Street Oscillate
For some time, it has been widely accepted that Bitcoin behaves much like a risk asset, tending to track Wall Street sentiment. In particular, its positive correlation with the Nasdaq 100 and Nvidia (NVDA) has been strong in recent years. However, that relationship has broken down in recent weeks.
Bitcoin’s correlation table shows that its relationship with the S&P 500, Nasdaq 100, and Nvidia has effectively fallen to zero over the past 20 days. While Wall Street indices remain just shy of their record highs, Bitcoin has started to roll over since President Trump reintroduced his tariff threats.
However, this does not tell the full story, as it could be argued that Bitcoin — and cryptocurrencies in general — are largely ignoring Wall Street’s risk-on rallies, yet still fall in tandem during volatile down days.
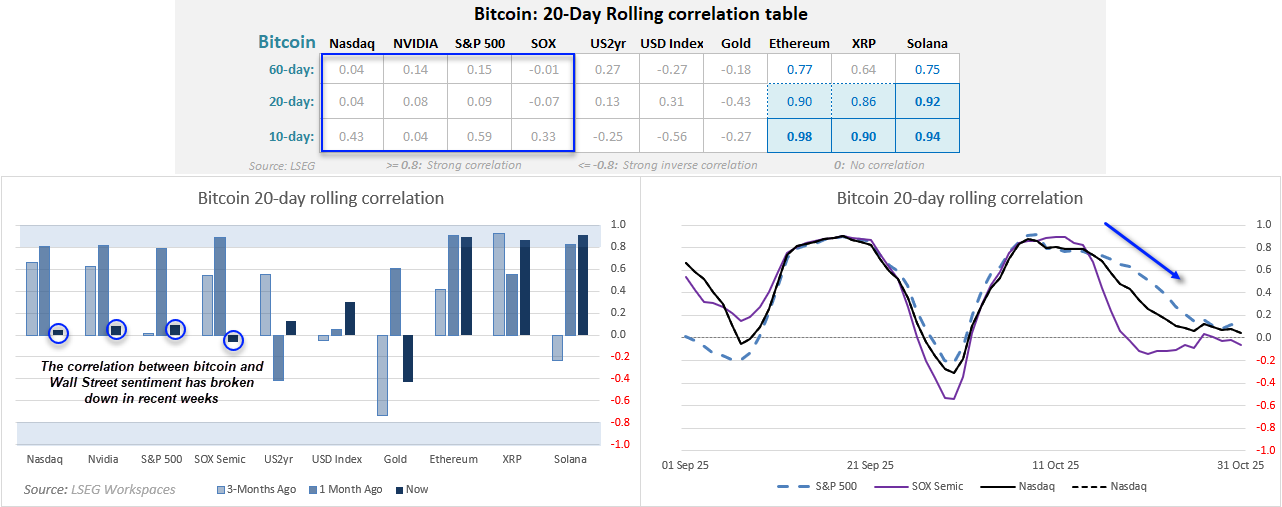
Chart analysis by Matt Simpson - Source: LSEG


Bitcoin Still Reacts to Nasdaq Sell-Offs Despite Broken Correlation
I compared the futures charts of the Nasdaq 100 and Bitcoin, each with a negative daily percentage indicator. While their broader trends have diverged in recent weeks, Bitcoin continues to respond to Nasdaq sell-offs by trading sharply lower. In essence, Bitcoin appears to be ignoring Wall Street’s optimism but reacting swiftly to its pessimism. The fact that the Nasdaq has formed a bearish reversal near record highs should therefore be a warning sign for Bitcoin traders.
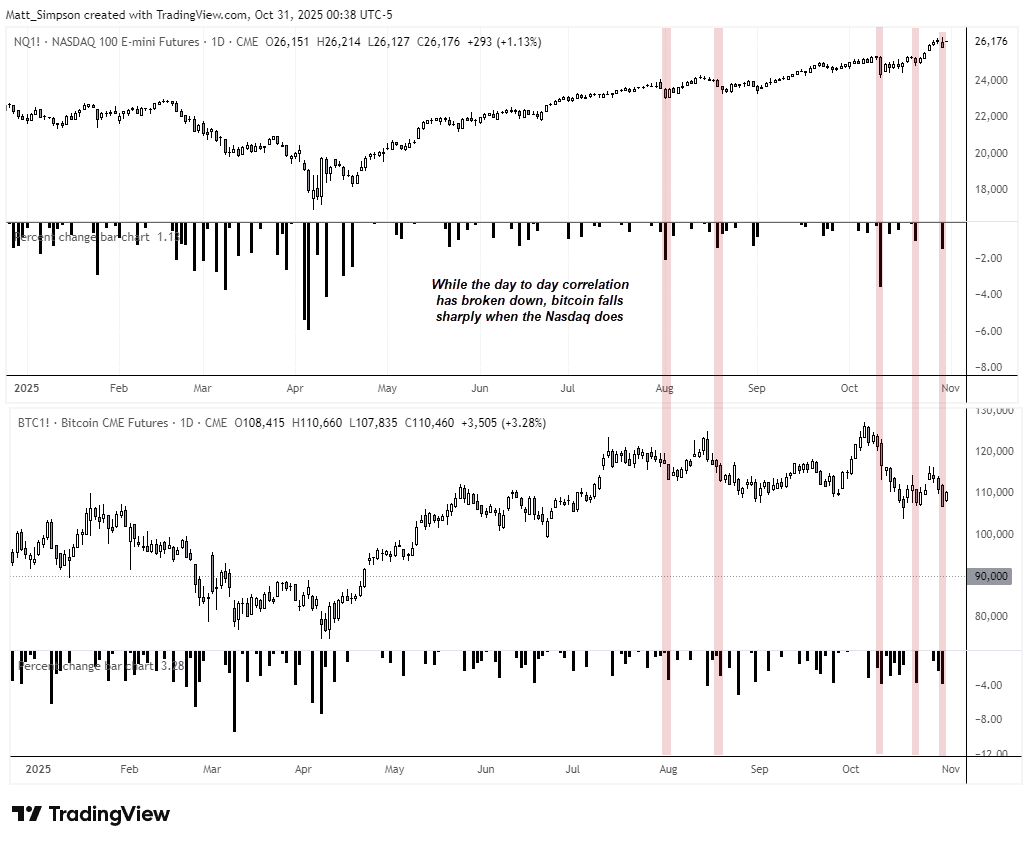
Chart analysis by Matt Simpson - Source: COMEX, TradingView


Nasdaq 100 Futures (NQ) Technical Analysis
The daily chart shows that a bearish outside day formed on the Nasdaq 100 futures chart on Thursday. Prices made a brief intraday high before reversing sharply lower to close at a three-day low. While prices have since returned to Thursday’s open, I suspect bears may be lurking above, ready to fade moves toward the record high within the upper wick.
Some mean reversion may now be due towards the 10-day SMA (25,684). Should sentiment deteriorate, bears could target gap support at 25,509 — a break below which would risk a retest, and potentially a break, of the October high. If Wall Street indices such as the Nasdaq begin to retreat, Bitcoin is likely to follow.
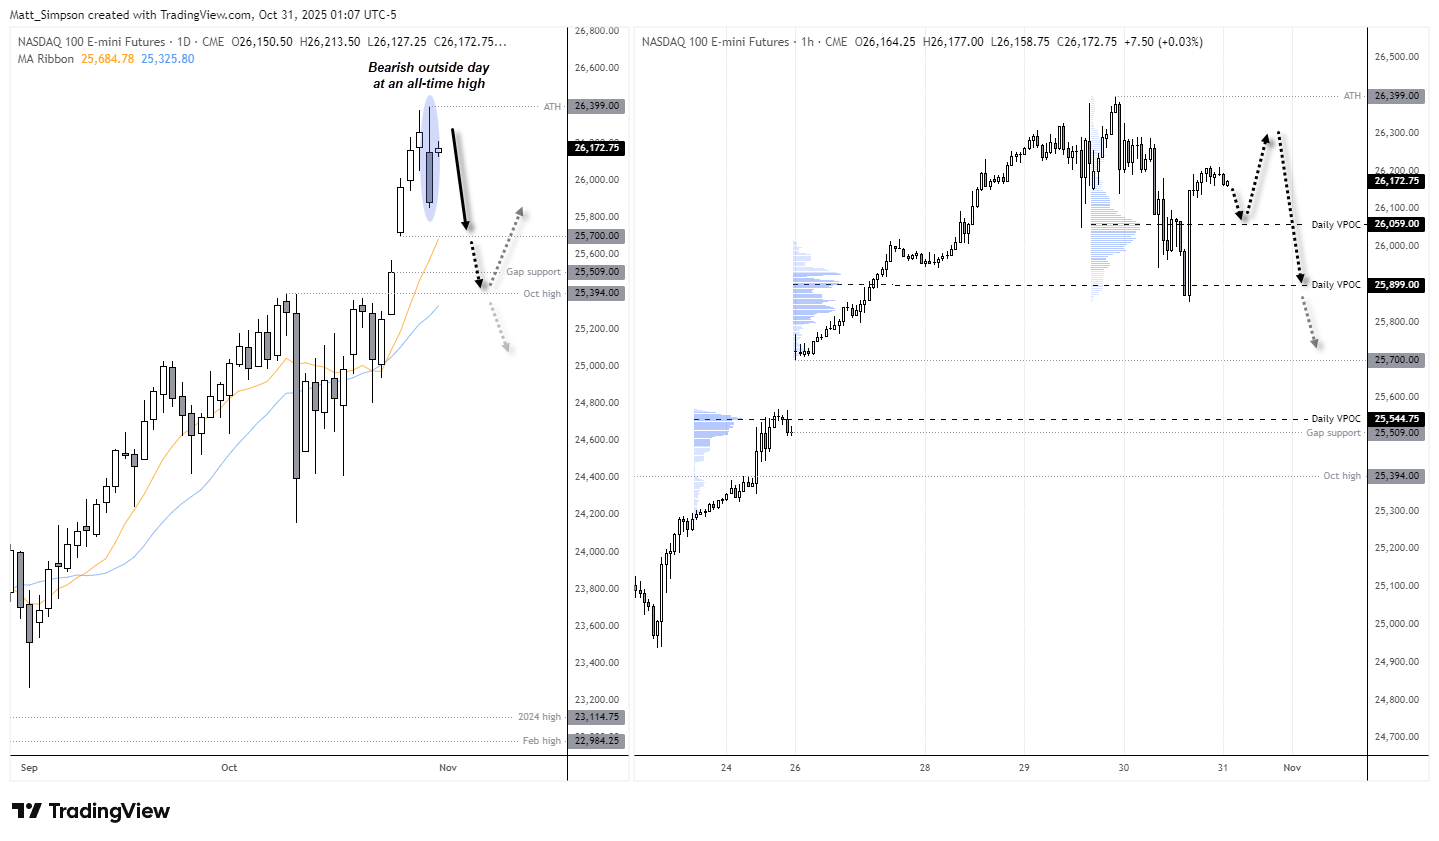
Chart analysis by Matt Simpson, Source: TradingView, CME Futures, NASDAQ 100 E-mini Futures
Bitcoin (BTC/USD) Technical Analysis: Bitcoin vs US Dollar
The daily chart shows that Bitcoin has fallen sharply from its record high towards the 200-day EMA. While bulls managed to find some traction ahead of a rebound attempt, a lower high has since formed. Prices are once again trying to hold above the 200-day EMA after closing beneath it on Thursday. However, if Wall Street weakens, Bitcoin seems likely to break decisively below its 200-day averages.
Should a short-term bounce occur, my bias remains bearish while prices remain below the 117,145 high. Bears may look to fade rallies towards that level in anticipation of a deeper bearish breakout.
Downside targets include 102,720 and the 100,000 handle, while a move below 98,000 could expose the 90,000 area — clearing the high-volume node around 99,230.

Chart analysis by Matt Simpson - data source: TradingView Bitcoin CME Futures (BTC1!)
View the full economic calendar
View the full economic calendar
-- Written by Matt Simpson
Follow Matt on Twitter @cLeverEdge
How to trade with City Index
You can trade with City Index by following these four easy steps:
- Open an account, or log in if you’re already a customer
• Open an account in the UK
• Open an account in Australia
• Open an account in Singapore
- Search for the market you want to trade in our award-winning platform
- Choose your position and size, and your stop and limit levels
- Place the trade
Latest market news




The complete CFD trading experience
Award-winning platforms, competitive spreads, low commissions and dedicated support.
We live and breathe the markets and are dedicated to helping traders realise their ambitions as we continue to set the industry bar.
Economic calendar
Web Trader platform
Our sophisticated web-based platform is packed with features.
Related articles
EUR/USD weekly outlook: FOMC and ECB to set the tone
The current backdrop is modestly bearish. On Friday, the EUR/USD closed modestly lower, down for the third consecutive day. The pair also posted a weekly decline after staging a modest recovery attempt in the previous week. Out of the past 8 weeks, the EUR/USD has fallen on 6 occasions. There is not much supporting factors for the single currency right now. So, the upside remains capped.

Crypto Analysis: Even Bitcoin Cannot Escape the Market's Lack of Direction
Major cryptocurrencies continue to trade within a pattern of repeated rebounds without being able to break through key technical barriers, a situation that is gradually giving way to increasingly well-defined consolidation ranges.

S&P 500, Nasdaq, Dow Forecast: Nasdaq Selloff Deepens as Dow Rally Stalls 10 24 2026
A failed S&P breakout and looming Nasdaq support test raise the stakes for next week’s Fed decision and October’s monthly close.

StoneX Europe Ltd may make third party material available on this website which may contain information included but not limited to the conditions of financial markets. The material is for information purposes only and does not contain, and should not be construed as containing, investment advice and/or investment recommendation and/or an investment research and/or an offer of or solicitation for any transactions in financial instruments; any decision to enter into a specific transaction shall be made by the client following an assessment by him/her of their situation.
StoneX Europe Ltd makes no representation or warranty and assumes no liability as to the accuracy or completeness of the information provided, nor any loss arising from any investment based on a recommendation, forecast or other information supplied. You should always seek independent advice as to your suitability to speculate in any related markets and your ability to assume the associated risks, if you are at all unsure. We are not under any obligation to update any such material. Any opinion made may be personal to the author and may not reflect the opinion of StoneX Europe Ltd.