



TLT ETF, Gold: Long bond bulls face first real test with directional risks for yields evenly balanced
Facing technical resistance, a 20-year Treasury auction and expectations for a low US PCE inflation report, this week looms as the first real test for recent long bond bulls. Gold traders will be watching events closely.
Share this:

- TLT, the EFT tracking the performance of longer-dated US Treasuries, has entered a bull market, climbing more than 20% from the recent lows
- Facing technical resistance, a 20-year US bond auction and expectations for a soft US PCE inflation report, this week looms as the first real test for recent long bond bulls
- Gold traders will be eyeing movements in US yields as it attempts to grind out a new trading range above $2000
Pivots here, there and everywhere as Fed signals cuts
Since the Federal Reserve first suggested tighter financial conditions were helping to reduce inflation for them, implicitly signaling rates were likely at their peak, there has been a mad rush into long bonds around the world. Yields have tumbled rapidly, amplified by the the Fed’s surprise dovish pivot during the December FOMC meeting last week.
But with around 140 basis points of rate cuts priced next year, you get the sense the easy gains for bond bulls have been made, especially when the Fed believes it can deliver a soft economic landing while the US government is expected to run trillion dollar deficits for the foreseeable future.
Directional risks for bond yields more balanced
Unless we see a hard landing, the directional risks for yields now look far more evenly balanced. And that’s before the risk of a no landing scenario is taken into consideration, something which has grown considerably with the Fed moving preemptively to signal policy easing with unemployment incredibly low by historical standards and inflation well above target.
TLT ETF enters bull market
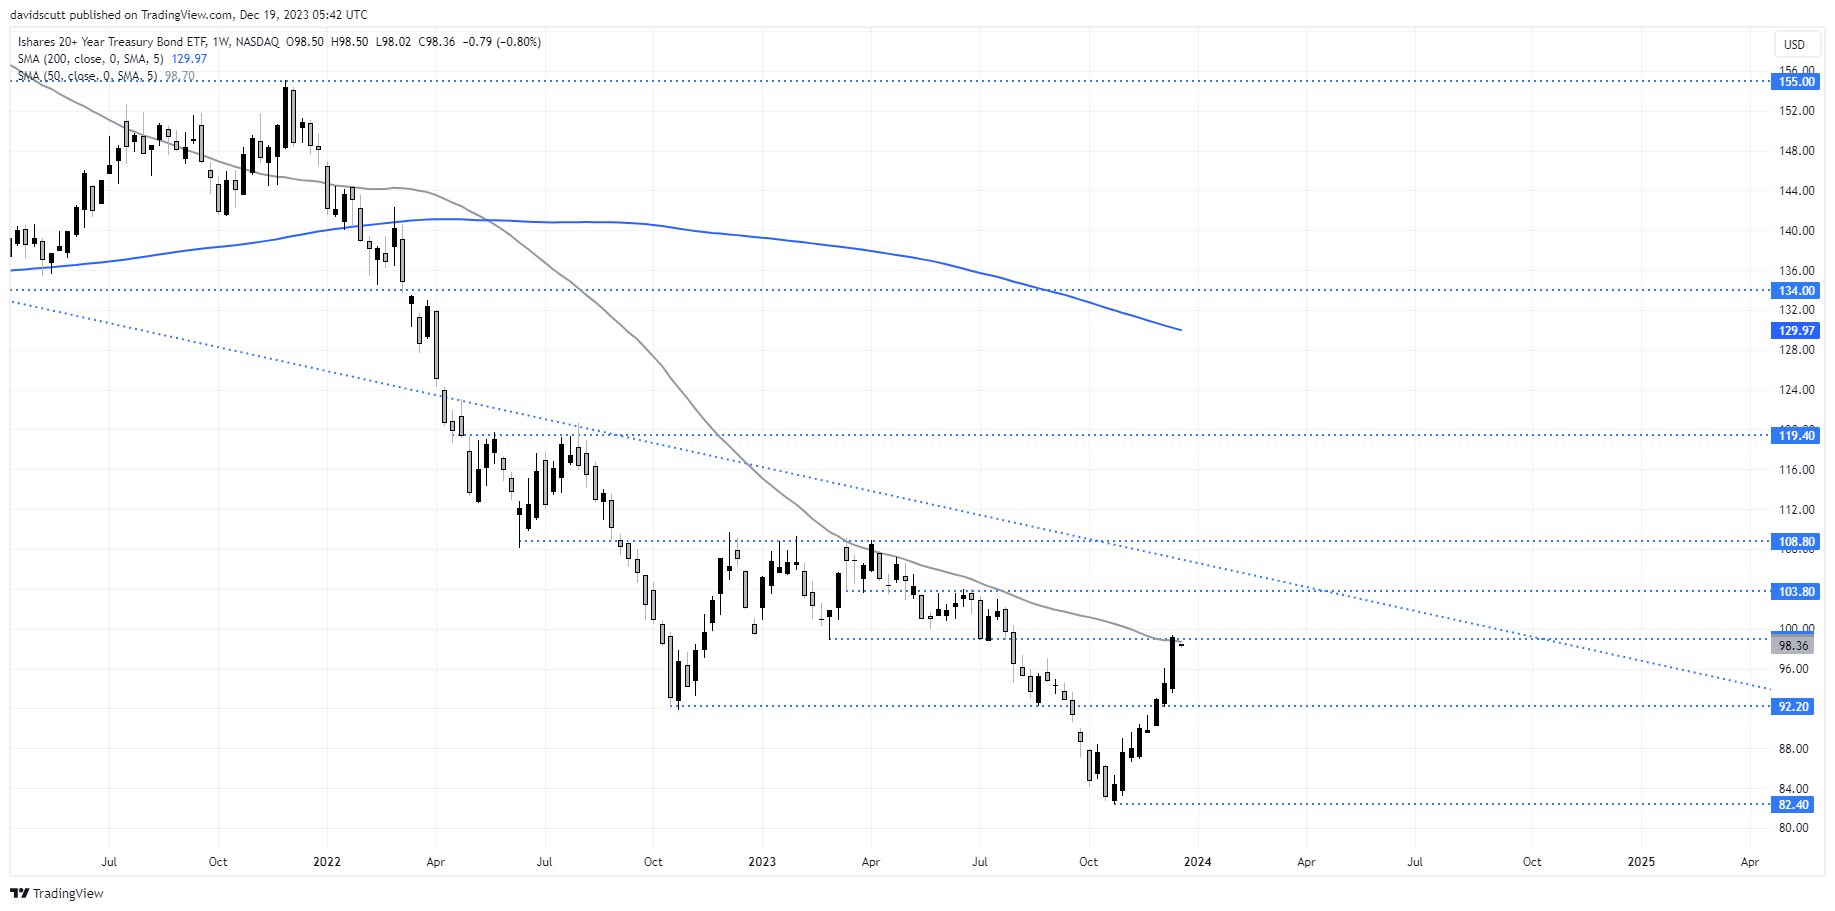
You can see how powerful the turnaround in US long bonds has been in the weekly chart of iShares’ 20+ Year Treasury Bond ETF, trading under the ticker code TLT. It’s entered a bull market from the recent lows, climbing more than 20%. While not overbought over the weekly timeframe, the rally has brought the ETF back to it’s 50-week moving average, a level it has not had a lot of success at over the past two years. Coupled with horizontal resistance at $99, this juncture comes across as the first real technical test for recent long bond bulls.
While momentum is entirely to the upside, anything that questions the disinflationary, soft landing narrative that’s driven the rebound carries the risk of sparking a modest reversal in yields. While most traders are eyeing off Friday’s US PCE inflation report as a potential catalyst, few will be aware the US Treasury is auctioning off a fresh 20-year bond line on Wednesday. Will buyers still flock to buy these bonds with yields now far less than what the were only two months ago – they’ve fallen more than 110 basis points!
On the downside, we may see bids around $96 on a pullback, although more meaningful support is not located until you get to $92.20. Should the bullish trend continue, there are several areas of resistance located between $103.80 to $108.80.
Gold stabilises above $2000
One commodity keeping a close eye on developments in US long bond yields is gold given they, along with fluctuations in the US dollar, are among the key long-term drivers of the bullion price. Following the blow-off-top record high set earlier this month, gold has recovered above $2000 recently, attracting bids on the abrupt decline in US yields and dollar following the Fed meeting last week.
With no clear directional signals to work off near-term, gold comes across as a watch and wait prospect, letting the price action deliver a decent trade setup. On the downside, $2008, $1975 and $1946 are the levels to watch. On the topside, $2048 and $2146.4 act as resistance.
-- Written by David Scutt
Follow David on Twitter @scutty
How to trade with City Index
You can trade with City Index by following these four easy steps:
- Open an account, or log in if you’re already a customer
• Open an account in the UK
• Open an account in Australia
• Open an account in Singapore
- Search for the market you want to trade in our award-winning platform
- Choose your position and size, and your stop and limit levels
- Place the trade

The complete CFD trading experience
Award-winning platforms, competitive spreads, low commissions and dedicated support.
We live and breathe the markets and are dedicated to helping traders realise their ambitions as we continue to set the industry bar.
Economic calendar
Web Trader platform
Our sophisticated web-based platform is packed with features.
Related articles

AUD/USD hammered by US yields and fading RBA hike bets
US yields, dollar strength and fading RBA hike bets have combined to drive AUD/USD to fresh multi-month lows. The macro and technical bias remains bearish, although history suggests parts of the move are now reaching unusually stretched levels.

Gold Price Outlook: XAU/USD Resistance at $4200 Sets Up for NFP
It was a strong sell-off to start the week in gold and despite a Tuesday bounce, sellers are continuing to push following a resistance hit at the $4200 level.


EUR/USD Forecast: Euro Struggles to Find Support Even After U.S. PCE Data
The euro continues to face a challenging environment in the short term. The currency has struggled to regain ground against a U.S. dollar that remains firmly supported, a dynamic reflected in EUR/USD, which has now recorded three consecutive losing sessions and a decline of roughly 0.6%.

StoneX Europe Ltd may make third party material available on this website which may contain information included but not limited to the conditions of financial markets. The material is for information purposes only and does not contain, and should not be construed as containing, investment advice and/or investment recommendation and/or an investment research and/or an offer of or solicitation for any transactions in financial instruments; any decision to enter into a specific transaction shall be made by the client following an assessment by him/her of their situation.
StoneX Europe Ltd makes no representation or warranty and assumes no liability as to the accuracy or completeness of the information provided, nor any loss arising from any investment based on a recommendation, forecast or other information supplied. You should always seek independent advice as to your suitability to speculate in any related markets and your ability to assume the associated risks, if you are at all unsure. We are not under any obligation to update any such material. Any opinion made may be personal to the author and may not reflect the opinion of StoneX Europe Ltd.