



US “Big Tech” earnings preview: FB, MSFT, GOOG, AMZN, and AAPL in focus
Below, we outline the key dates, expectations, and technical trends to watch on each of these tech behemoths...
Share this:

On the back of yesterday’s exploration of the three key themes to watch for the US Big Tech / FAAMG stocks this earnings season, we wanted to add a bit more color to the individual shares and their technical outlooks. Below, we outline the key dates, expectations, and technical trends to watch on each of these behemoths:
Facebook (FB) earnings technical analysis
Report date: October 25 after the close
Expectations: $3.16 of EPS on $29.5B in revenue
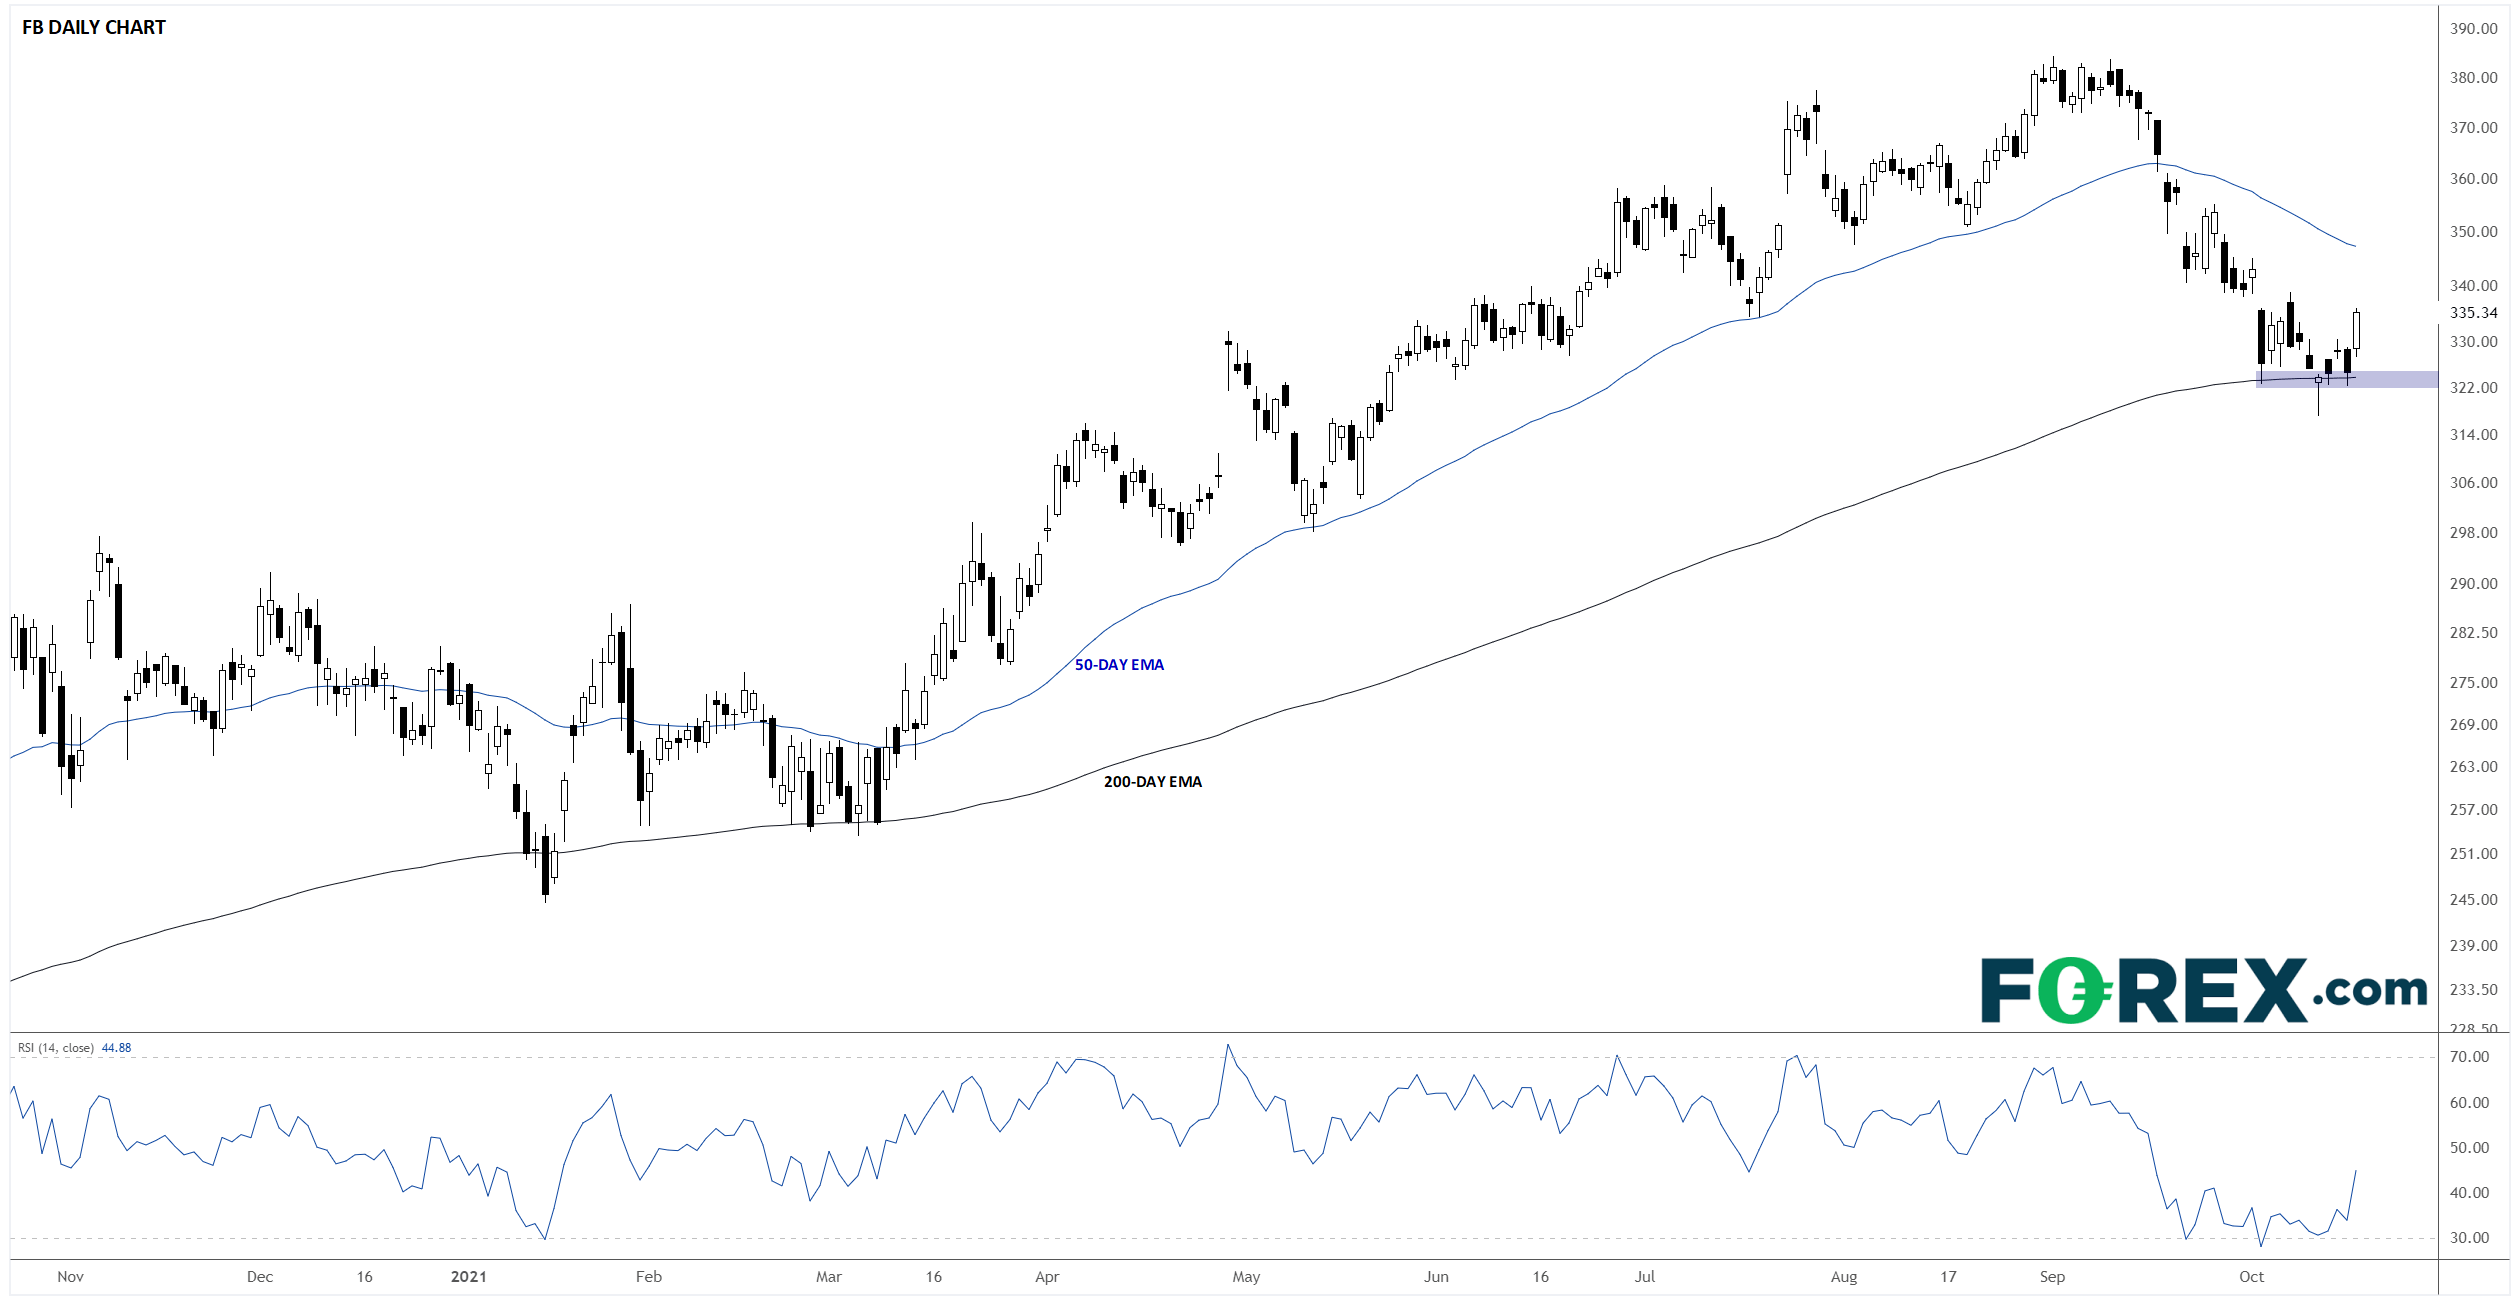
Unlike most of its FAAMG rivals, Facebook (FB) has seen a notable pullback from its early September record highs. As of writing, FB is in the midst of a -15% dip but finding some support at its rising 200-day EMA. Moving forward, that will be a critical level of support to watch, with a break below that zone (currently around $320) opening the door for a deeper pullback if earnings disappoint.
Source: StoneX, TradingView
Microsoft (MSFT) earnings technical analysis
Report date: October 26 after the close
Expectations: $2.06 of EPS on $44.0B in revenue
For its part, the stock of Microsoft (MSFT) is arguably the strongest in the sector. Prices are at record highs as we go to press and the company sports a staggering $2.3T market capitalization, trailing only Apple (AAPL) among all publicly traded companies. From a purely technical perspective, the path of least resistance remains to the topside, especially as long as prices can hold above $305, after a sideways consolidation over the last couple months has alleviated any concerns about short-term overbought trading conditions.

Source: StoneX, TradingView
Alphabet (GOOG) earnings technical analysis
Report date: October 26 after the close
Expectations: $23.13 of EPS on $63.4B in revenue
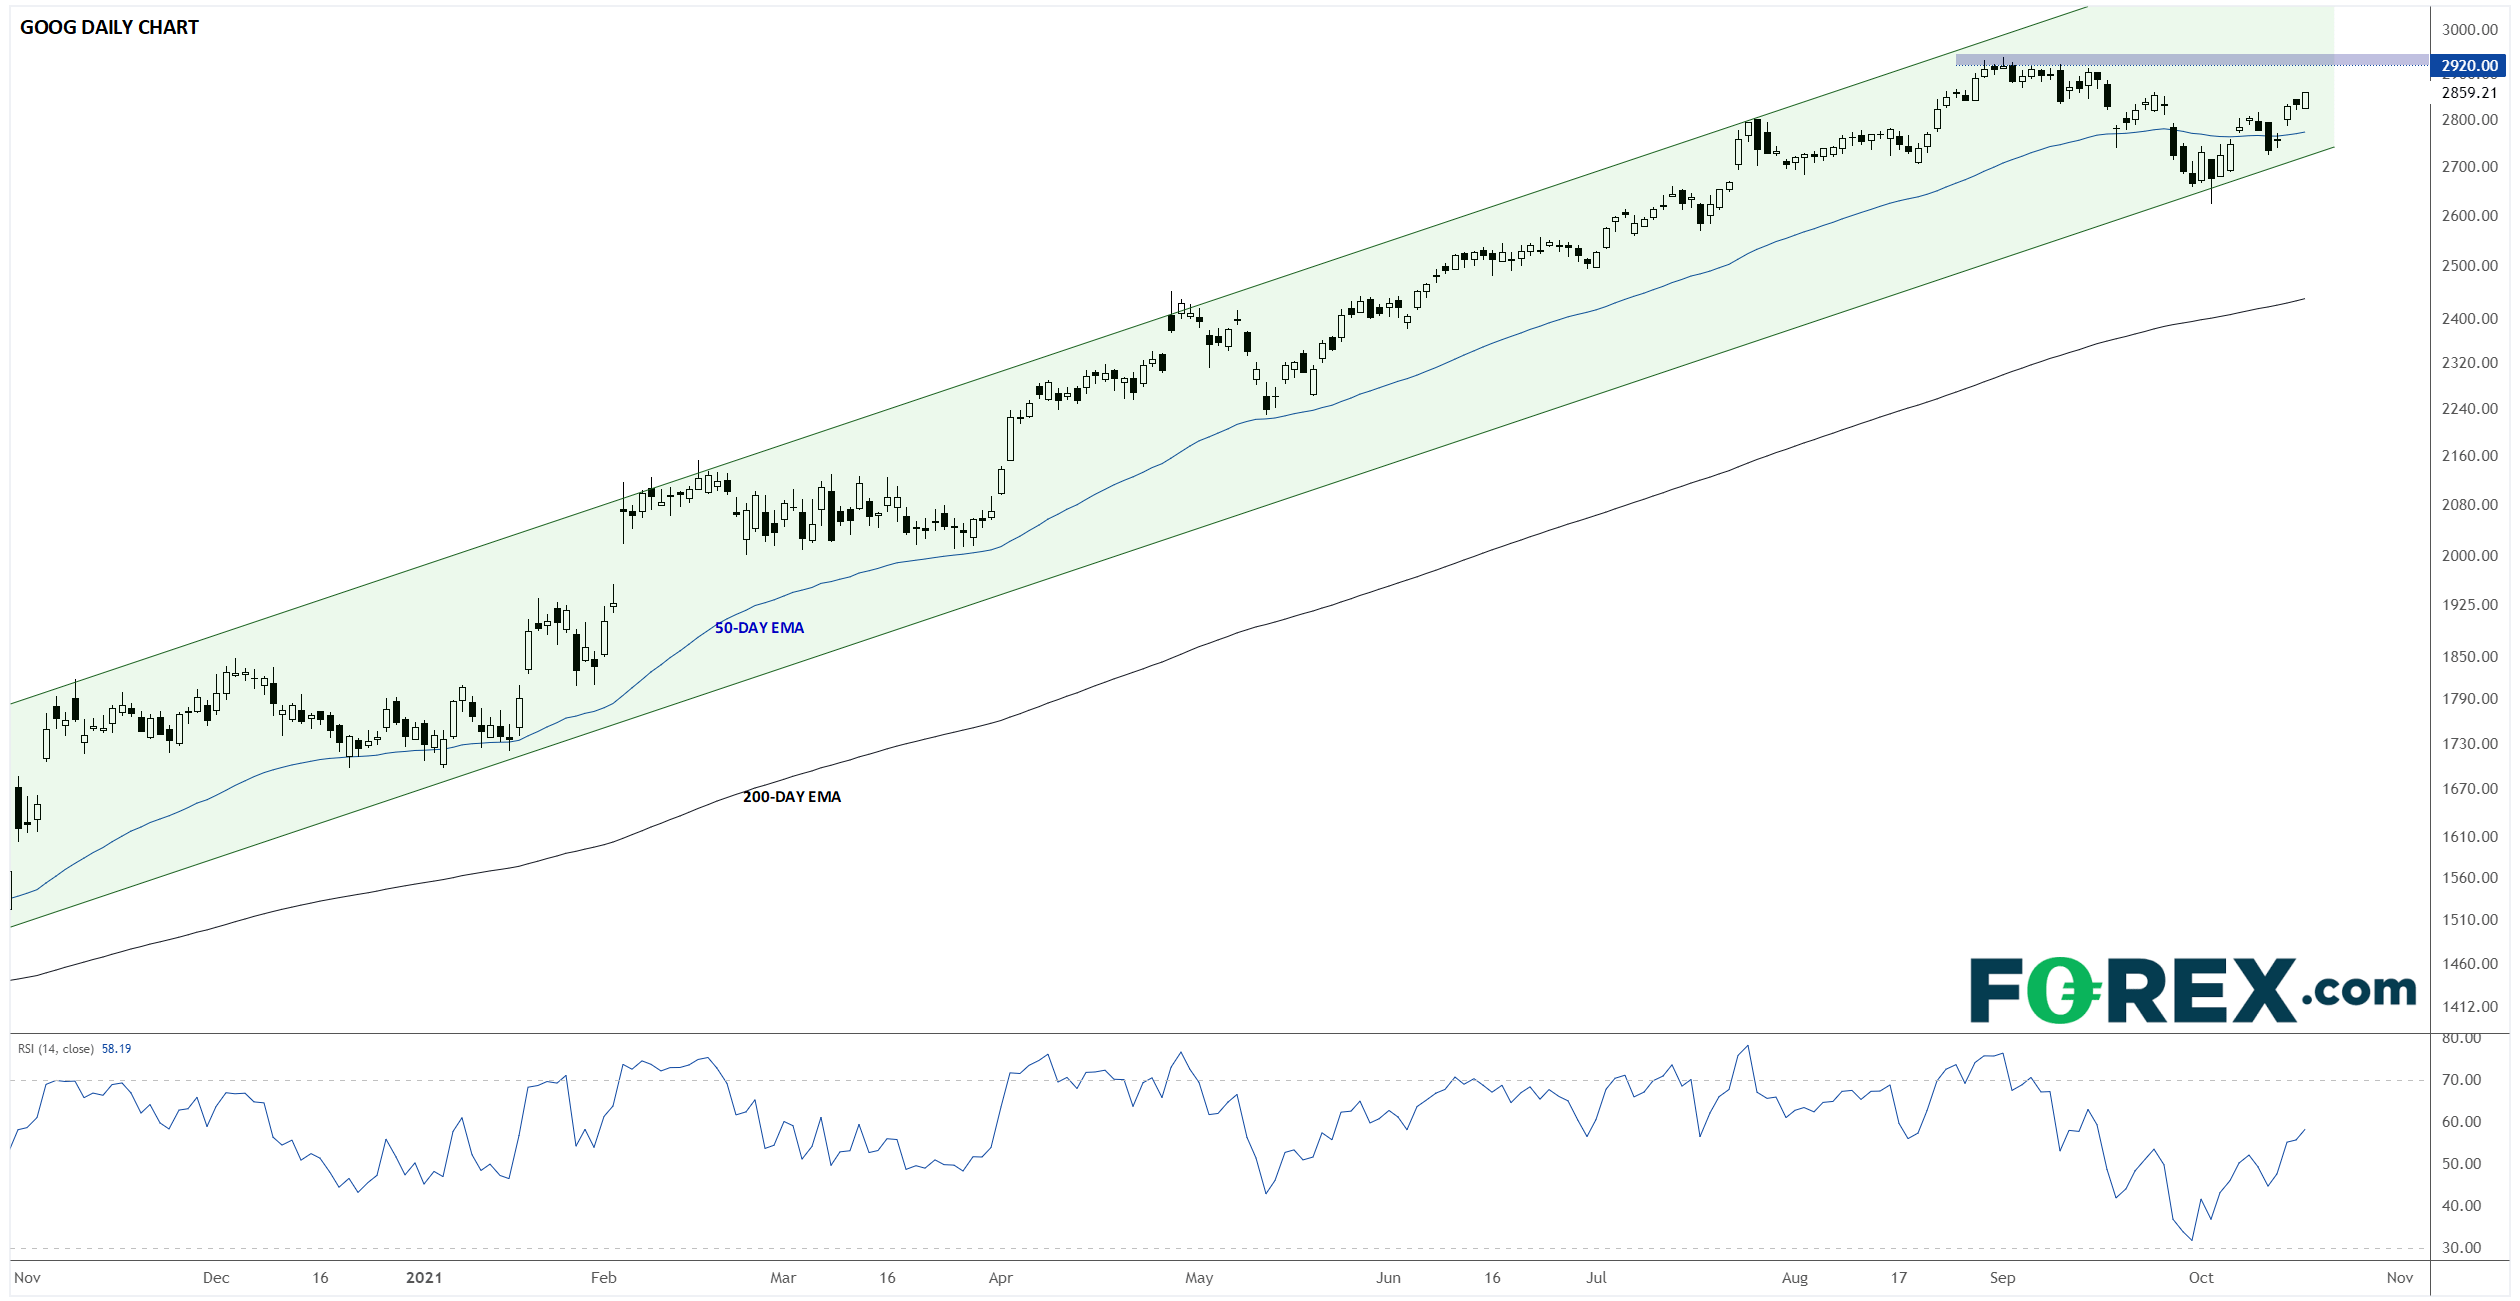
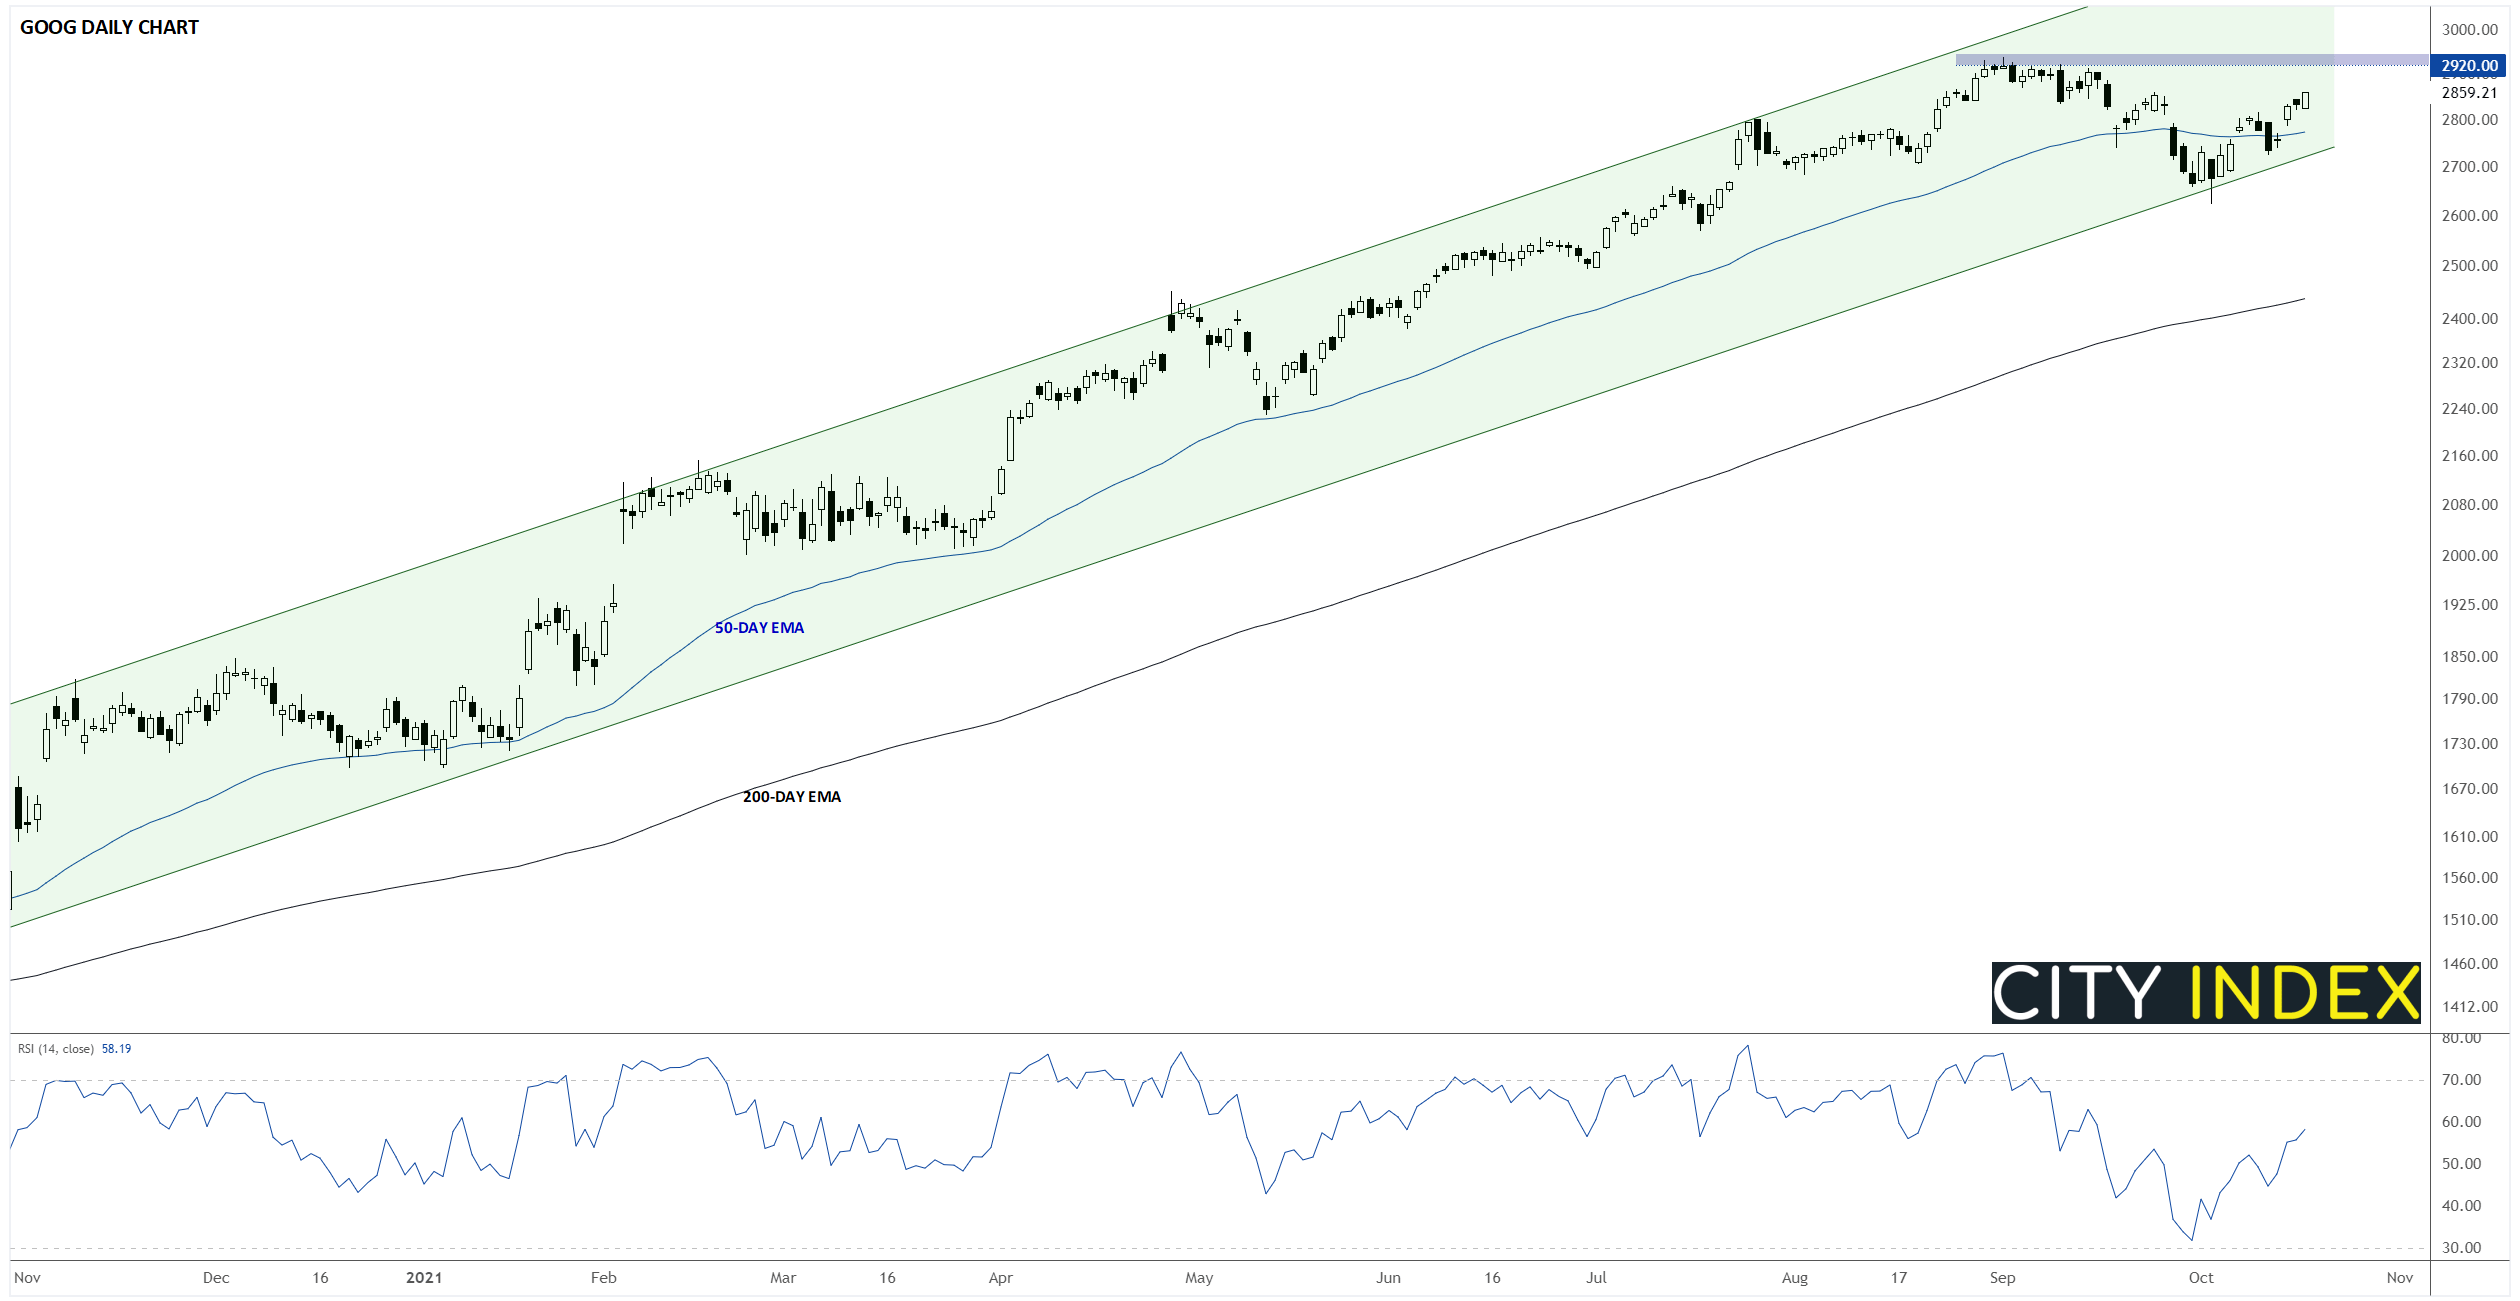
The stock of Alphabet (GOOG), the parent company of Google, never seems to get particularly perturbed regardless of what’s happening in the global economy. Not surprisingly, GOOG remains in a clear longer-term uptrend and has regained its 50-day EMA after seeing a -9% dip through the month of September. Moving forward, traders will key in on the previous record close near $2920, with a break above that level on a strong earnings report clearing the way for continued gains heading into the holiday season.
Source: StoneX, TradingView
Amazon.com (AMZN) earnings technical analysis
Report date: October 28 after the close
Expectations: $8.72 on $111.6B in revenue
Despite its ubiquity in the day-to-day lives of millions, if not billions, of consumers Amazon.com’s stock (AMZN) has spent the majority of the last year simply treading water in the $3,000-$3,500 range. A July foray above that resistance level was short-lived and the longer-term moving averages are relatively flat, so it will take a sustained break and hold above $3500 for bulls to feel comfortable that the stock is regaining its mojo.

Source: StoneX, TradingView
Apple (AAPL) earnings technical analysis
Report date: October 28 after the close
Expectations: $1.23 of EPS on $84.8B
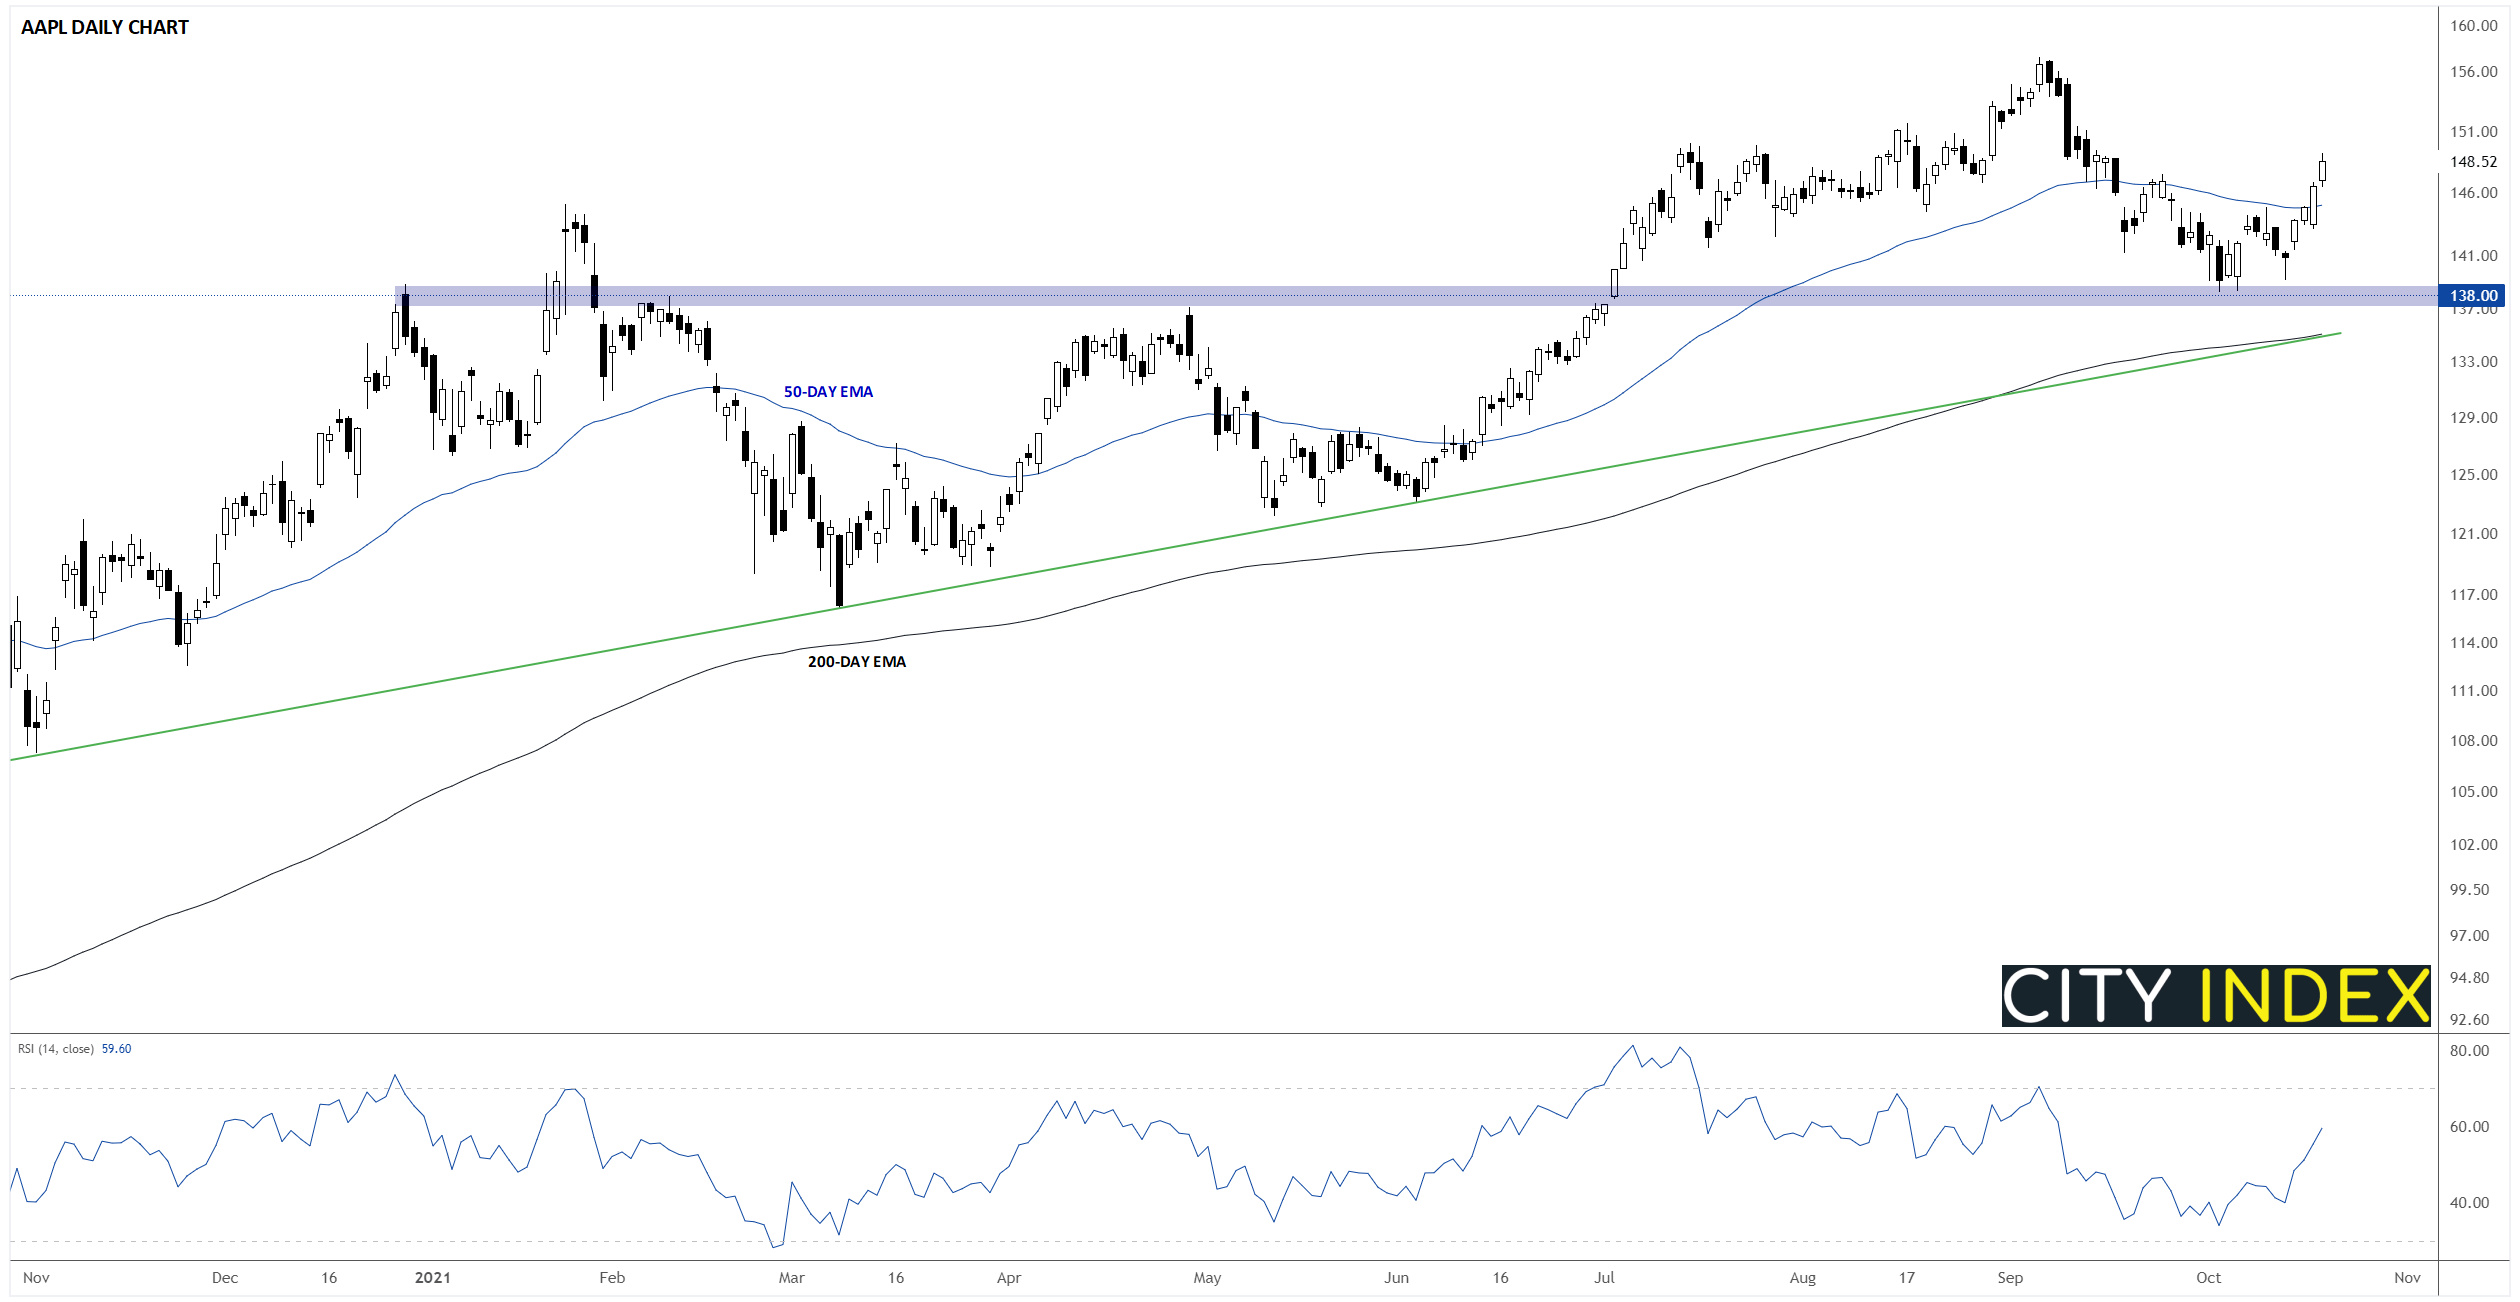
Last but certainly not least (in fact, it’s the “most” valuable publicly-traded company on the planet with a market capitalization in excess of $2.4T), Apple (AAPL) reports earnings on Thursday the 28th. From a technical perspective, the stock is in the midst of a -11% correction, though the recent price action suggests that the longer-term bullish trend remains intact. Moving forward, previous-resistance-turned-support in the $138 area will be critical to watch, with bulls comfortable adding to positions and awaiting new record highs as long as that level holds as a floor.

Source: StoneX, TradingView
How to trade with FOREX.com
Follow these easy steps to start trading with FOREX.com today:
- Open a Forex.com account, or log-in if you’re already a customer.
- Search for the market you want to trade in our award-winning platform.
- Choose your position and size, and your stop and limit levels.
- Place the trade.
On the back of yesterday’s exploration of the three key themes to watch for the US Big Tech / FAAMG stocks this earnings season, we wanted to add a bit more color to the individual shares and their technical outlooks. Below, we outline the key dates, expectations, and technical trends to watch on each of these behemoths:
Facebook (FB) earnings technical analysis
Report date: October 25 after the close
Expectations: $3.16 of EPS on $29.5B in revenue
Unlike most of its FAAMG rivals, Facebook (FB) has seen a notable pullback from its early September record highs. As of writing, FB is in the midst of a -15% dip but finding some support at its rising 200-day EMA. Moving forward, that will be a critical level of support to watch, with a break below that zone (currently around $320) opening the door for a deeper pullback if earnings disappoint.

Source: StoneX, TradingView
Microsoft (MSFT) earnings technical analysis
Report date: October 26 after the close
Expectations: $2.06 of
EPS on $44.0B in revenue
For its part, the stock of Microsoft (MSFT) is arguably the strongest in the sector. Prices are at record highs as we go to press and the company sports a staggering $2.3T market capitalization, trailing only Apple (AAPL) among all publicly traded companies. From a purely technical perspective, the path of least resistance remains to the topside, especially as long as prices can hold above $305, after a sideways consolidation over the last couple months has alleviated any concerns about short-term overbought trading conditions.

Source: StoneX, TradingView
Alphabet (GOOG) earnings technical analysis
Report date: October 26 after the close
Expectations: $23.13 of EPS on $63.4B in revenue
The stock of Alphabet (GOOG), the parent company of Google, never seems to get particularly perturbed regardless of what’s happening in the global economy. Not surprisingly, GOOG remains in a clear longer-term uptrend and has regained its 50-day EMA after seeing a -9% dip through the month of September. Moving forward, traders will key in on the previous record close near $2920, with a break above that level on a strong earnings report clearing the way for continued gains heading into the holiday season.
Source: StoneX, TradingView
Amazon.com (AMZN) earnings technical analysis
Report date: October 28 after the close
Expectations: $8.72 on $111.6B in revenue
Despite its ubiquity in the day-to-day lives of millions, if not billions, of consumers Amazon.com’s stock (AMZN) has spent the majority of the last year simply treading water in the $3,000-$3,500 range. A July foray above that resistance level was short-lived and the longer-term moving averages are relatively flat, so it will take a sustained break and hold above $3500 for bulls to feel comfortable that the stock is regaining its mojo.

Source: StoneX, TradingView
Apple (AAPL) earnings technical analysis
Report date: October 28 after the close
Expectations: $1.23 of EPS on $84.8B
Last but certainly not least (in fact, it’s the “most” valuable publicly-traded company on the planet with a market capitalization in excess of $2.4T), Apple (AAPL) reports earnings on Thursday the 28th. From a technical perspective, the stock is in the midst of a -11% correction, though the recent price action suggests that the longer-term bullish trend remains intact. Moving forward, previous-resistance-turned-support in the $138 area will be critical to watch, with bulls comfortable adding to positions and awaiting new record highs as long as that level holds as a floor.
Source: StoneX, TradingView
How to trade with City Index
You can trade easily trade with City Index by using these four easy steps:
- Open an account, or log in if you’re already a customer
• Open an account in the UK
• Open an account in Australia
• Open an account in Singapore
- Search for the company you want to trade in our award-winning platform
- Choose your position and size, and your stop and limit levels
- Place the trade
Latest market news




The complete CFD trading experience
Award-winning platforms, competitive spreads, low commissions and dedicated support.
We live and breathe the markets and are dedicated to helping traders realise their ambitions as we continue to set the industry bar.
Economic calendar
Web Trader platform
Our sophisticated web-based platform is packed with features.
Related articles
Stocks on Watch After CPI-Fueled Breakdown: SPX, Nasdaq, NVDA
Coming into the week there was an early case of divergence as AI and tech had started to show lag behind the S&P. That shift is growing more noticeable following a higher-than-expected CPI print.


Hang Seng Tech: Improving earnings can't stop the technical breakdown
Hang Seng Tech continues to slide despite improving earnings expectations across many major constituents. With valuations contracting and key technical support broken, the question is whether the selling has further to run.


S&P 500 Pulls Back From Another Fresh ATH As Yields Soften
Both the S&P and Nasdaq set fresh ATHs on Wednesday, and despite relief in yields, stocks are pulling back again today.
StoneX Europe Ltd may make third party material available on this website which may contain information included but not limited to the conditions of financial markets. The material is for information purposes only and does not contain, and should not be construed as containing, investment advice and/or investment recommendation and/or an investment research and/or an offer of or solicitation for any transactions in financial instruments; any decision to enter into a specific transaction shall be made by the client following an assessment by him/her of their situation.
StoneX Europe Ltd makes no representation or warranty and assumes no liability as to the accuracy or completeness of the information provided, nor any loss arising from any investment based on a recommendation, forecast or other information supplied. You should always seek independent advice as to your suitability to speculate in any related markets and your ability to assume the associated risks, if you are at all unsure. We are not under any obligation to update any such material. Any opinion made may be personal to the author and may not reflect the opinion of StoneX Europe Ltd.