






US dollar analysis: Can the dollar defy the gravity of seasonality?
Traditionally the US dollar falls into year end. But with it having fallen -5% this quarter already, has it had enough of a beating?
Share this:

US dollar technical analysis (weekly chart):
It has clearly not been the best quarter for the US dollar, having fallen over -5% from its October high already. I flagged a bearish engulfing week on the US dollar index at the end of October, noting that such patterns rarely appeared in isolation - and that it could point to further downside in the weeks ahead. I’m glad to see that the US dollar has continued to fall in line with that bias, but is it now becoming too late to short the dollar? Possibly.
What makes the -5% decline interesting is that that such falls marked bullish reversals twice earlier this year. I even marked 101.59 as a potential target as it denoted a -5.1% decline from its October high. And that level was achieved last week around its low.
On a purely technical basis I would be looking for a bounce from current levels and suspect one could be close. Although the bearish fly in the bullish ointment is that the US dollar tends to fall in the final two weeks of December.
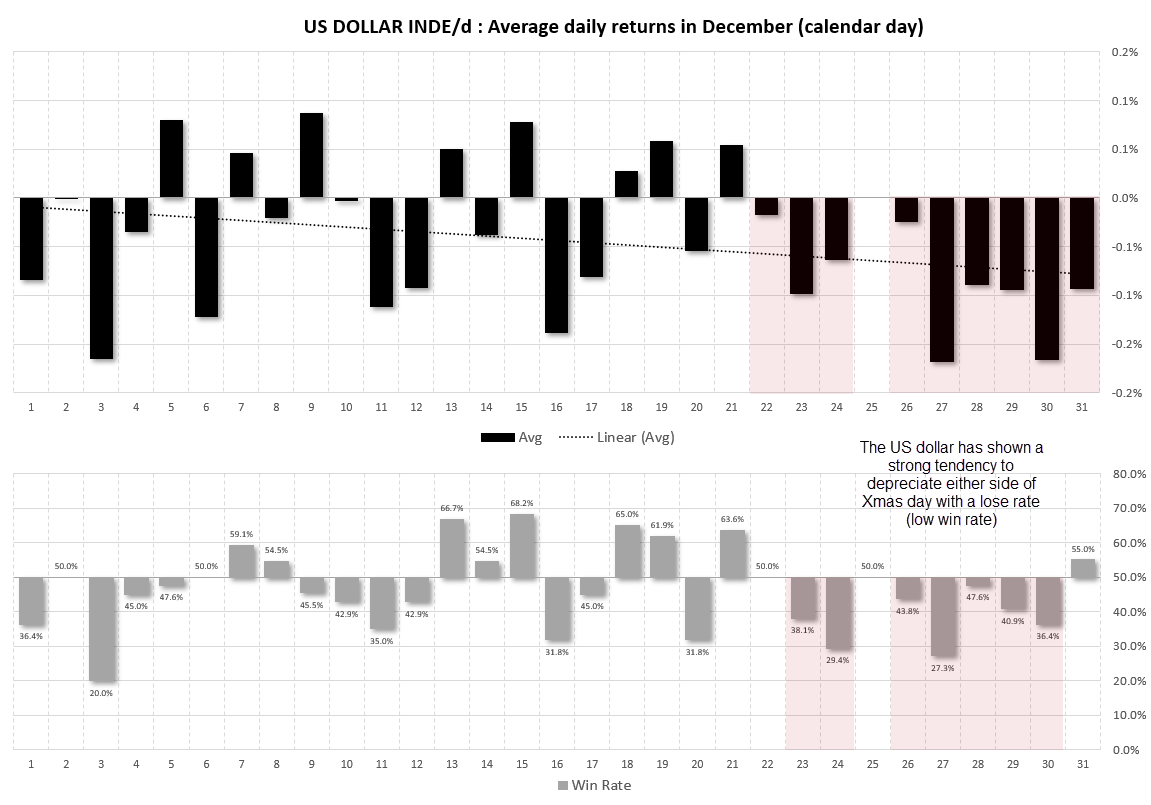
US dollar index seasonality in December, January.
The following chart shows the average daily returns of the US dollar index in December, since 1971. What is striking about the data is how it shows a strong tendency to depreciate between December 23rd – 30th alongside a low ‘win rate’ (the majority of the days have been bearish with negative returns).
At a high level this points towards a week finish for the US dollar. However, will it simply follow this pattern blindly, or will traders take notice of the fact that the US dollar has already underperformed. Moreover, Wall Street indices printed bearish outside days on Wednesday after seemingly delivering Santa’s rally earlier than usual.
Ultimately, for the US dollar to continue falling from here likely requires the S&P 500, Nasdaq 100 and Dow Jones to shake off yesterday’s bearish candles and extend their already bullish moves for the month. At the very least it could not hurt for USD bears to warrant caution around these lows and look for evidence of a swing low.
Besides, the first two weeks of January tend to benefit the US dollar. And if December’s selloff came early and is exhausted, then so could January’s gains. In theory.
US dollar index analysis (daily chart):
The daily chart is clearly within a classic downtrend, with its series of lower lows and highs. We saw strong volumes on the bearish days of December 13th and 14th into the cycle lows, and these bears are presumably still short. Prices are now coiling within a potential bearish continuation pattern, a break beneath which could imply a move towards the 100 handle.
However, a bullish divergence is forming in the RSI 14, and the false break of support has also been coupled with a higher low. What we now need is the market to tip its hand. A strong close higher could imply that we have seen the cycle low last week, and that January’s rally is coming early. Bulls could look for a daily close above 102.30 to confirm a bullish reversal on the daily timeframe. Alternatively, bears could wait for a break or daily close beneath last week’s low to assume bearish continuation.
Regardless of its next move on the daily chart, I continue to suspect the US dollar’s downside move is overcooked, and that a bounce is due – whichever side of the New year it comes.
-- Written by Matt Simpson
Follow Matt on Twitter @cLeverEdge
How to trade with City Index
You can trade with City Index by following these four easy steps:
- Open an account, or log in if you’re already a customer
• Open an account in the UK
• Open an account in Australia
• Open an account in Singapore
- Search for the market you want to trade in our award-winning platform
- Choose your position and size, and your stop and limit levels
- Place the trade
Related tags:

The complete CFD trading experience
Award-winning platforms, competitive spreads, low commissions and dedicated support.
We live and breathe the markets and are dedicated to helping traders realise their ambitions as we continue to set the industry bar.
Economic calendar
Web Trader platform
Our sophisticated web-based platform is packed with features.
Related articles

USD/JPY weekly outlook: Quarter turn scrambles rates regime
USD/JPY’s tight relationship with front-end US rates broke down sharply last week, but quarter-turn flows and positioning suggest the disconnect may prove temporary.


USD/CAD forecast: rally could accelerate above June highs at 1.4250
USD/CAD recovered quickly after weaker US jobs data, keeping the bullish trend in focus. A move above the June highs could accelerate the rally as inflation keeps the Fed under pressure.


USD Sets Fresh Yearly High as EUR/USD Drops Dramatically, USD/JPY Stable
Well, it was a week of USD strength that wasn’t entirely pushed by USD/JPY, as a strong sell-off in EUR/USD has pushed the major pair to its most oversold state in a decade.

StoneX Europe Ltd may make third party material available on this website which may contain information included but not limited to the conditions of financial markets. The material is for information purposes only and does not contain, and should not be construed as containing, investment advice and/or investment recommendation and/or an investment research and/or an offer of or solicitation for any transactions in financial instruments; any decision to enter into a specific transaction shall be made by the client following an assessment by him/her of their situation.
StoneX Europe Ltd makes no representation or warranty and assumes no liability as to the accuracy or completeness of the information provided, nor any loss arising from any investment based on a recommendation, forecast or other information supplied. You should always seek independent advice as to your suitability to speculate in any related markets and your ability to assume the associated risks, if you are at all unsure. We are not under any obligation to update any such material. Any opinion made may be personal to the author and may not reflect the opinion of StoneX Europe Ltd.