


US Dollar Breakout Has History on Its Side
The US dollar is breaking higher as financial conditions tighten at a historically rapid pace. Both history and the charts suggest the rally may have further to run.
Share this:

- US financial conditions tightening at exceptional speed
- DXY gained in eight of 10 comparable episodes
- Falling wedge breakout puts 104.68 in focus
- Dovish Fed shift, weaker US data greatest threat to bullish bias
US economic data surprises have surged to multi-year highs, while hawkish commentary from Federal Reserve officials has helped drive a substantial repricing of the US interest rate outlook. That's contributed to a rapid tightening in US financial conditions, a development that may help explain not only the recent turbulence across risk assets, but also the renewed strength in the US dollar.
Our historical research suggests there's good reason to pay attention, with the dollar typically benefiting during similar episodes of rapid tightening. The accompanying video examines what we've uncovered and why it matters for broader financial markets.
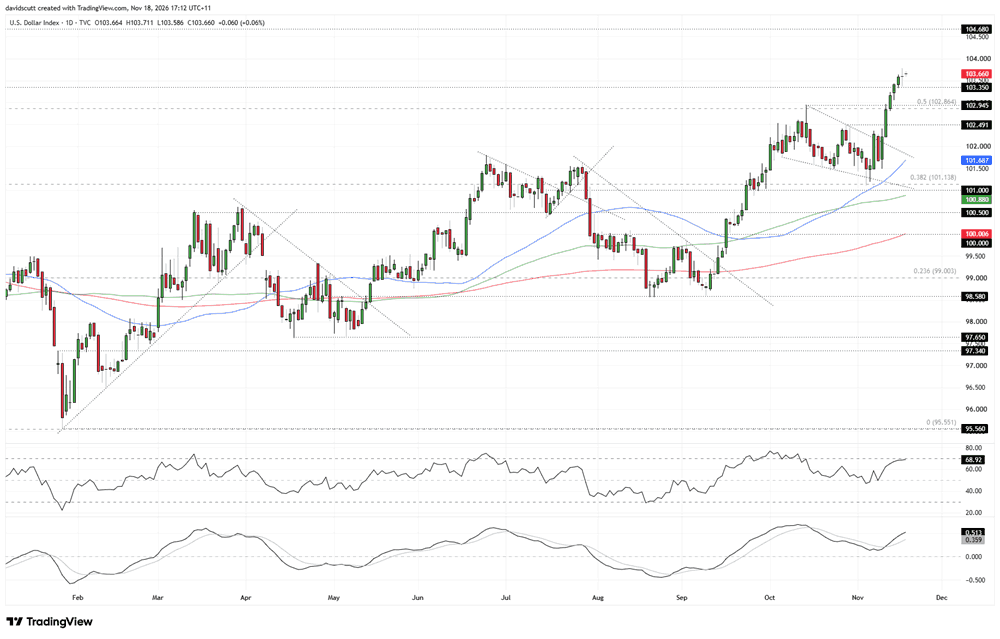
DXY Bulls retain control after falling wedge breakout
The DXY technical picture remains bullish following the breakout from a falling wedge continuation pattern. The price has reclaimed the previous high at 102.945 and pushed above 103.35, a level that repeatedly acted as support and resistance during 2024 and 2025. Tuesday's doji saw buyers emerge on a retest of 103.35, reinforcing its importance as the first level to watch underneath.
Momentum indicators broadly support further upside, with MACD turning higher in positive territory and RSI (14) comfortably above 50. However, RSI has yet to set a fresh higher high alongside the price, suggesting the latest breakout isn't being accompanied by an equivalent acceleration in momentum. That's something to keep on the radar, although it doesn't yet confirm bearish divergence and therefore isn't a signal to act upon.
Source: TradingView
With little meaningful resistance immediately overhead, 104.68, the March 2025 high, is the next upside target, followed by 105.44, a minor level that acted as both support and resistance in late 2024.
On the downside, a break back beneath 103.35 would bring 102.945 and the 50% Fibonacci retracement of the January 2025 to January 2026 decline into focus. Both may now provide support after previously acting as resistance. Below that, 102.49 is a minor level of interest before a more substantial support zone around 101, including the 38.2% Fibonacci retracement at 101.138.
Last week's hawkish Fed commentary was a major catalyst behind the sharp repricing of US interest rate expectations, contributing to the rapid tightening in financial conditions. Reversing that pressure may require Fed officials to walk back some of their hawkishness or US economic data to start disappointing. With positive economic surprises at multi-year highs, there's little evidence of the latter just yet. Until we see a convincing bearish price signal or a meaningful shift in the macro backdrop, retaining a bullish DXY bias makes more sense than fading the rally.


The complete CFD trading experience
Award-winning platforms, competitive spreads, low commissions and dedicated support.
We live and breathe the markets and are dedicated to helping traders realise their ambitions as we continue to set the industry bar.
Economic calendar
Web Trader platform
Our sophisticated web-based platform is packed with features.
Related articles
US Dollar Breakout Has History on Its Side
The US dollar is breaking higher as financial conditions tighten at a historically rapid pace. Both history and the charts suggest the rally may have further to run.

Bitcoin's Bigger Problem Isn't AI
Bitcoin, semis and even gold are getting hammered. Our research suggests an overlooked macro force may help explain why, with Bitcoin now approaching a major support zone.

US dollar rally loses yield support as Nvidia looms
US yields are retreating, but the dollar isn't following. With risk aversion potentially keeping it supported, Nvidia's results could determine whether emerging reversal signals in AUD/USD and EUR/USD develop further.
StoneX Europe Ltd may make third party material available on this website which may contain information included but not limited to the conditions of financial markets. The material is for information purposes only and does not contain, and should not be construed as containing, investment advice and/or investment recommendation and/or an investment research and/or an offer of or solicitation for any transactions in financial instruments; any decision to enter into a specific transaction shall be made by the client following an assessment by him/her of their situation.
StoneX Europe Ltd makes no representation or warranty and assumes no liability as to the accuracy or completeness of the information provided, nor any loss arising from any investment based on a recommendation, forecast or other information supplied. You should always seek independent advice as to your suitability to speculate in any related markets and your ability to assume the associated risks, if you are at all unsure. We are not under any obligation to update any such material. Any opinion made may be personal to the author and may not reflect the opinion of StoneX Europe Ltd.